Contrary to the sometimes biased view of China as a highly centralized country, China’s provinces play a decisive economic role, and local governments in these provinces are assigned growth targets, which are sometimes ambitious.
The ability of local governments to support economic activity will be key to enabling China to achieve its GDP growth target (close to +5% in 2024, as officially announced by the authorities, and close to +5.5% based on the growth targets for each province).
This first note aims to map Chinese provinces according to certain economic characteristics and to measure their fragility/capacity to support economic activity. A second note will return in more detail to the intrinsic mechanisms and channels of vulnerability.
The economic characteristics of the provinces are very heterogeneous. Those with the greatest weight in total GDP would have robust budgetary margins, unlike other provinces that are more vulnerable (real estate shock, risk to the sustainability of their debt).
Identifying the vulnerabilities and support capacities of the provinces allows us to isolate a group of 15 provinces (63% of GDP) with solid fundamentals, which in principle would make it easier for them to achieve their growth targets in 2024.
On the other hand, 10 provinces (18% of GDP) have high levels of vulnerability, increasing the likelihood that their GDP growth will fall short of the 2024 targets, which could cost between -0.3 and -0.6 percentage points of aggregate GDP growth.

5%! This figure corresponds to the GDP growth target set by the Chinese government for 2024 (« close to +5% »). Given the accumulation of signs of a slowdown, this figure is striking. It seems optimistic to some [1], due to the slowdown in the Chinese economy andthe reduction in room for maneuver, while to others [2]this target seems modest, being the lowest recorded in the last decade (excluding the Covid-19 period).
Who is right? Who is wrong? Probably no one and everyone at the same time! If China were to achieve this target in 2024, it would mean that it would have to record an average growth rate of close to +1.2% on a quarterly basis, which is well below the pre-crisis average: +1.6% between 2015 and 2019, with growth falling below +1.4% only twice in 20 quarters. Based on this observation, the authorities’ target seems modest at first glance. Nevertheless, achieving it remains a challenge for the authorities, who are facing an ongoing real estate crisis and slowing private consumption. This target would only be achieved at the cost of increased intervention by the authorities.
Rather than questioning the level of the growth target, the real question in 2024 concerns the channels of vulnerability of the Chinese economy and its degree of fragility, modulated by the effective capacity to intervene to counter any form of slowdown. This means looking at the situation in China’s provinces, which play a key role in driving economic activity but whose high levels of debt could be a serious drag.
This first article will provide an economic overview of China’s provinces and present the main findings of an exercise to identify their vulnerabilities and their capacity to sustain economic activity. A second article will examine in greater detail the main issues facing China’s provinces.
A province-by-province approach: does significant heterogeneity mask poor performance at the aggregate level?
The Chinese economy is paradoxical, a theme that is central to a chapter devoted to this countryin the latest book by BSI Economics. One of the paradoxes is linked to the vision of a large, entirely centralized Chinese entity. This analytical bias obscures the predominant role of the provinces.
Each year, the central authorities setgrowth targetsfor the provinces via local governments (LG). In this context, LGs are required to carry out large-scale projects, particularly to develop infrastructure and support key sectors (such as automotive, energy, and high tech), and contribute significantly to stimulating economic activity. LG, whose budget balance has deteriorated in recent years [3], therefore resort to debt to finance these projects and also benefit from transfers from the central government.
The maps below provide an initial overview of the reality of China’s provinces and the significant heterogeneity of the territory.
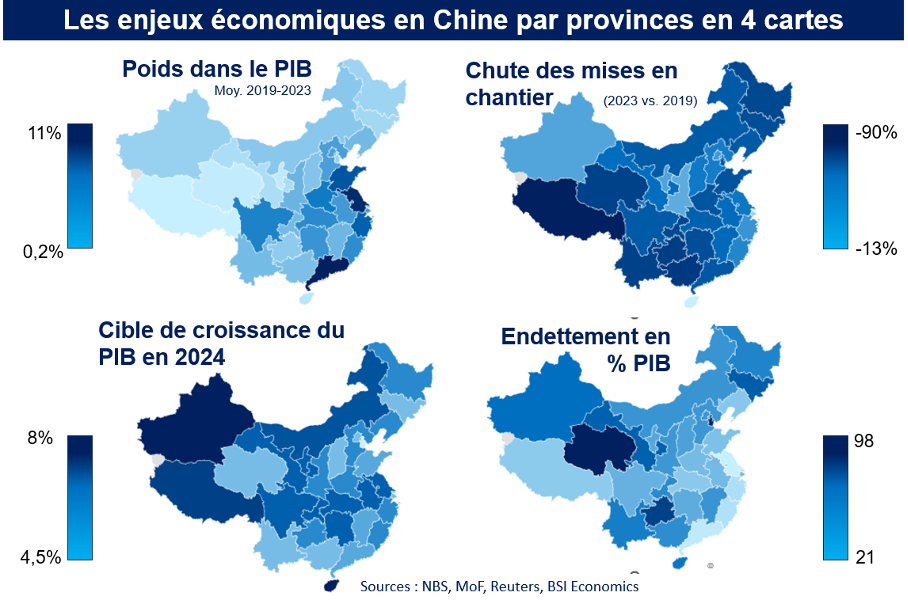
Weight in total GDP: Six of the coastal provinces/municipalities (Shandong, Jiangsu, Shanghai, Zhejiang, Fujian, and Guangdong from north to south) account for nearly 43% of GDP and are the engines of growth in China. In inland China, only two provinces account for more than 4.5% of GDP (Henan and Sichuan). Eleven provinces account for less than or equal to 2% of the total.
GDP growth target for 2024: Aggregating the provinces’ growth targets for 2024, the total GDP growth target would be +5.5%[4]in 2024, with higher targets in inland Chinese provinces (+6% or more) than in those closer to the coast (around +5.2%). In the latter, the growth targets for 2024 are fairly close to those for 2023.
Drop in housing starts: With a few exceptions, the average weight of the real estate sector is fairly consistent across the country. All provinces have been affected by the real estate crisis, and the extent of the decline in housing starts between 2019 and 2023 is an interesting indicator for assessing the degree of exposure to the real estate crisis. The decline was much more pronounced in the western provinces, but systemically important regions such as Shandong and Guangdong also posted sharp declines (-64%). This sensitivity to the downturn in the real estate sector will most likely be a major factor to consider in 2024.
Debt as a percentage of GDP: The level of debt varies greatly from one province to another, with debt remaining contained among the coastal provinces (between 20% and 40% of each province’s respective GDP). Five provinces have levels above 60% (Gansu, Guizhou, Jilin, Qinghai, Tianjin), which at first glance seems to indicate relatively higher vulnerability. It should be noted that there is almost a reversal of colors between this map and the one showing weight in GDP, but not necessarily with the one showing growth targets for 2024.
This preliminary examination is necessary because it lays the groundwork for a more in-depth analysis to assess the fragility of Chinese growth. Four main observations can be made at this stage:
- Almost all provinces appear to be affected by the contraction of the real estate market, and the need to support this sector is a point of vigilance in 2024 (with the possible exception of Hainan and Shanghai).
- It would appear that the regions driving economic activity (mainly on the southern coast) have the fiscal space to support activity while absorbing a prolonged shock to the real estate sector.
- This seems to be less the case for certain provinces in inland China, but their ability to have a significant impact at the aggregate level is more tenuous.
- Provinces with debt levels at the high end of the range are being given some of the highest GDP growth targets.
Summary of vulnerabilities and capacity for intervention by province
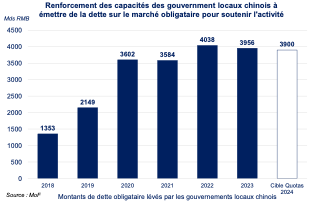
Since the second half of the 2010s, the authorities have stepped up their support for economic activity, which has led to a widening of the public deficit [5], which reached a low point during the COVID-19 crisis and remains very high at present (nearly -10% of GDP in 2023). In this context, local governments have had to raise significant amounts of bond debt to meet their financing needs. At the end of 2023, local governments benefited from a significant transfer of RMB 1 trillion(nearly USD 140 billion) from the central government, and provinces were authorized to issueRMB 3.9 trillion (nearly USD 545 billion) of debt securities on the bond marketin 2024. This follows a target of RMB 3.8 trillion in 2023, and some early issuances brought the total amount issued to RMB 3.996 trillion, levels well above what existed previously (see chart below).
These funds are in principle used to support public investment projects in infrastructure, but could also be used for other purposes (in particular to support players weakened by tensions in the real estate market [6]). In addition,12 regions(including Chongqing, Guizhou, Jilin, Liaoning, Tianjin, and Yunnan) are subject to tighter control of their debt dynamics by the central government and will be putting certain infrastructure projects on hold. These various factors point to potential obstacles to financing activity in 2024.
To determine whether or not there is cause for concern about Chinese growth in 2024, a more in-depth analysis of the weaknesses and capabilities of each province is needed. It appears that the main weakness of the provinces lies in the sustainability of their debt and the state of their public accounts. In addition, it is necessary to determine whether each province has the means to achieve its GDP growth target.
To do this, a two-dimensional analysis was chosen to identify the provinces with the greatest potential and those with the highest level of vulnerability, through the creation of two indices:
- The public accounts strength/vulnerability index includes several elements relating to public finances (dependence on real estate revenues, expenditure-to-revenue ratio) and the structure of local and regional government debt (particularly refinancing risk).
- The economic activity support capacity index incorporates real estate aspects, public policy margins (ability to raise debt on the bond market, bank credit growth), and economic activity performance.
The results of this two-dimensional analysis are shown in the maps and graph below (full details are available in the Appendix at the end of the article):
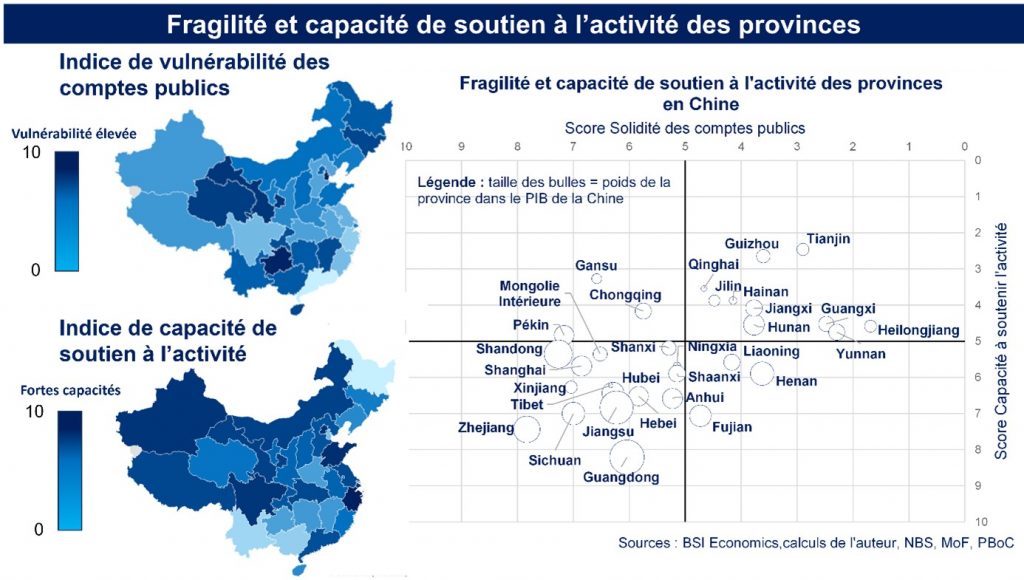
How should these results be interpreted?
- The provinces in the lower left of the graph have the highest scores for public finance strength/vulnerability and activity support capacity, i.e., those with the strongest economic fundamentals in principle. These 15 provinces account for 63% of China’s GDP. If they all achieve their growth targets [7], they alone will guarantee an aggregate growth figure of +3.4%. In the event of an average underperformance of -0.5 points relative to this target (remember that -0.5 is the average level of underperformance over several years), this figure would fall to +3.1%.
- The three provinces in the upper left corner show a certain strength in their public accounts, but their economic support capacity index remains relatively weak. These provinces (7% of GDP) could therefore encounter difficulties in achieving their growth targets in 2024. In the event of average underperformance of -0.5 points (see previous point), the impact on aggregate GDP growth would be negligible (-0.03 points). In the event of serious difficulties, if each of these provinces shows a gap of around -3.4 pts between their target and actual growth (the largest gap for a province in 2023: Heilongjiang), this would cost up to -0.2 pts of aggregate GDP.
- The provinces in the box at the top right are those with the most deteriorated indices. These 10 provinces (18% of Chinese GDP) appear to be the most fragile and least able to sustain activity. If these 10 provinces show the same gap between their growth target and actual growth in 2024 as in 2023, this would cost China’s aggregate GDP 0.3 percentage points. In a negative scenario with a gap of 3.4 percentage points (see previous point), this would cost aggregate GDP up to 0.6 percentage points.
- The three provinces shown in the box at the bottom right, on the other hand, have somewhat fragile public finances but are well placed to support economic activity. The risk in this type of province is that these support policies cannot be fully deployed in order to preserve the sustainability of public finances. They account for 12% of GDP and, if they underperform their growth target, they would cost between -0.1 percentage points of GDP (average underperformance scenario of -0.5) and -0.4 percentage points (scenario of -3.4 percentage points) of aggregate GDP.
This overview provides an initial glimpse of the vulnerabilities and support capacities of a highly fragmented China. The information provided puts into perspective the extent of the fragility of local governments, which is ultimately mainly concentrated in provinces with a relatively moderate weight in China’s total GDP.
This therefore helps to partially mitigate the messages of mistrust regarding the Chinese economy for 2024. However, vigilance remains essential, as several important factors are not addressed in this note (except in terms of scoring indicators), particularly regarding the repercussions of the local government-LGFV nexus.
Given the fragmented nature of this first note, a second note, available on the BSI Economics website, will attempt to go into greater depth and decipher the mechanisms at work, illustrating them with specific examples from certain provinces.
V.L with the invaluable assistance of Evelyne Banh and Anthony Morlet-Lavidalie
Appendix
Methodology
The two indices are obtained using a relative scoring tool, which assigns scores from 0 to 10 to a series of indicators for the 31 provinces.
To simplify the calculations, the number of indicators has been limited to six for each of the two indices. These 12 indicators are divided into two sub-pillars for each index.
These indicators are based on the latest available data (end of 2023 in most cases, March 2024 for debt schedules and government forecasts). Some are calculated in terms of level, others in terms of change, depending on their relevance to the analysis (specified in the definition of the indicator in the table below).
Each indicator is assigned a weighting, at the author’s discretion, based on the estimated relevance of the indicator, resulting in an aggregate score between 0 and 10 (10 = maximum score, best performance, 0 = opposite).
The indicators and scores by province are all available in the Appendix with the summary table at the end of the article, with a color code to better visualize good performance (green colors) and poor performance (red colors).
Summary table

[1]Seethis article in Les Echos.
[2]Seethis article in Le Parisien.
[3]There are several reasons for this deterioration in local government finances. Firstly, there are structural causes: local governments incur significant levels of expenditure despite a chronic revenue shortfall that is only partially offset by transfers from central government. These factors are explained in detail ina note from the French Treasury. Added to this are cyclical factors, with a decline in tax revenues during the health crisis and an increase in various forms of economic support spending. In addition, the real estate crisis is having a direct impact on local authorities’ revenues from land sales (which are falling sharply).
[4]Historically, Chinese provinces have tended to underperform, reducing aggregate GDP growth by an average of 0.5 percentage points. As a reminder, in 2023, 18 out of 31 provinces recorded growth below their targets, 1 province met its target, and 12 provinces exceeded their targets.
[5]In this note, the definition of public deficit used is that which combines the balance of the central government and local governments.