Summary:
– With weakened competitiveness, high private debt, sluggish investment, and a currency that has appreciated significantly over the past decade, China needs to reinvent itself but faces significant economic imbalances.
– On June 12, 2015, the Shanghai Composite Index peaked at 5,166 points, up from just over 2,000 points in June 2014. The index thus gained more than 150% in one year.
– The bubble eventually burst and in less than three months, nearly USD 4 trillion in market capitalization evaporated from Chinese equity markets, with Chinese households bearing the brunt of these losses.
– Emerging Asia, which has long been one of the drivers of global growth, is slowing down in the wake of the Chinese giant, pushing the global economy further into a form of secular stagnation.
On June 12, 2015, the Shanghai Composite Index[1] peaked at 5,166 points, up from just over 2,000 points in June 2014. The index had therefore gained more than 150% in one year. According to the main valuation ratios, the index had deviated significantly from its fundamental value: the rise could not last. It was therefore quite logical that this bubble on the Chinese stock markets burst.
By July 8, 2015, nearly one-third of the Shanghai Composite Index’s capitalization had evaporated. But the fall did not stop there: on Monday, July 27, the index lost 8.5%, as it did on Monday, August 24. These » Black Mondays » represent the two largest falls in the index since the 2007-08 financial crisis. Finally, on August 25, the index lost another 7.6% to end below 3,000 points.
This stock market crash, which we call the « 2015 People’s Bubble of China » (2015 PBoC), dragged other major stock markets down with it, but the contagion remained limited in both scope and duration, given the domestic nature of this bubble. In this article, we look back at the causes, triggers, and consequences of the » 2015 PBoC. »
The formation of the bubble: a textbook case in China!
The economic context:
For 30 years, the Chinese economy has grown by an average of around 10% per year in real terms, but since 2010, the trend has been downward and this slowdown appears to be structural (see chart below). In other words, the Middle Kingdom is unlikely to return to double-digit growth for a number of years. In its April 2015 World Economic Outlook, the IMF forecasts real GDP growth of +6.8% in 2015 and +6.3% in 2016. Even if the official growth figures leave many observers skeptical, what matters is not so much the level of GDP growth as its trend. On this subject, all economists agree that the Chinese growth model, based on exports, investment, and a favorable exchange rate, has now been proven. This is why the Chinese authorities have, in recent years, decided to shift towards a growth model based more on domestic consumption and services.
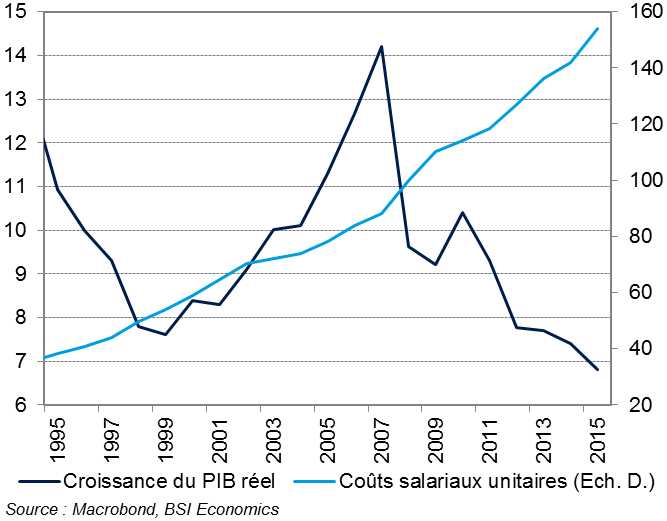
Real GDP growth (year-on-year, %) and unit labor costs in China (2008 = 100)
The social context:
Wages have risen rapidly and sharply: unit labor costs have quadrupled in the space of 20 years (see chart above). Although it has moved slightly upmarket, China has become less competitive and is now itself undergoing economic relocation. As proof, the manufacturing sector has found itself with overcapacity and we have been seeing a real contraction in this sector for several months (the official manufacturing PMI was in contraction territory in August 2015 at 49.7).
At the same time, China has experienced an unprecedented rural exodus (the urbanization rate rose from 31% of the total population in 1995 to over 54% in 2014), pushing residential investment to represent around 15% of GDP. These investments were logically accompanied by a very sharp increase in private debt (according to analyses conducted by Bloomberg, corporate and household debt rose from 125% of GDP in 2008 to nearly 210% of GDP in 2015). The real estate market overheated and, since the end of 2013, prices have skyrocketed in China’s major cities. This is mainly due to the limited investment alternatives available to Chinese households. Indeed, domestic financial markets remain underdeveloped and capital controls prevent Chinese households from investing abroad. In addition, the weakness of China’s social security system makes real estate investment an important tool for retirement savings.
The financial context:
The country experienced its most significant domestic financial crisis in 2015. Once relative calm returned to the real estate markets in early 2015, households’ excess savings poured massively into local stock markets. In addition, the central government encouraged individuals to open securities accounts, and it was often households with little or no training in stock market investments that rushed to make these investments. Numerous trading rooms sprang up in China’s major cities, and at the peak of the bubble there were as many as 90 million securities accounts. At the end of 2014, in order to continue to « drive up prices, » the Chinese authorities allowed households to take on debt to acquire more financial securities. With multiple cuts in key interest rates and reserve requirement ratios, the People’s Bank of China eased bank lending conditions, and the phenomenon of purchasing financial securities on credit thus intensified. Rises as sharp as those experienced by the Chinese stock markets are very often a sign of the formation of a rational bubble, see Shiller (1981) and Blanchard and Watson (1982). And like any bubble, it eventually burst.
The bursting of the bubble: what was bound to happen happened…
The chronology of the series of falls:
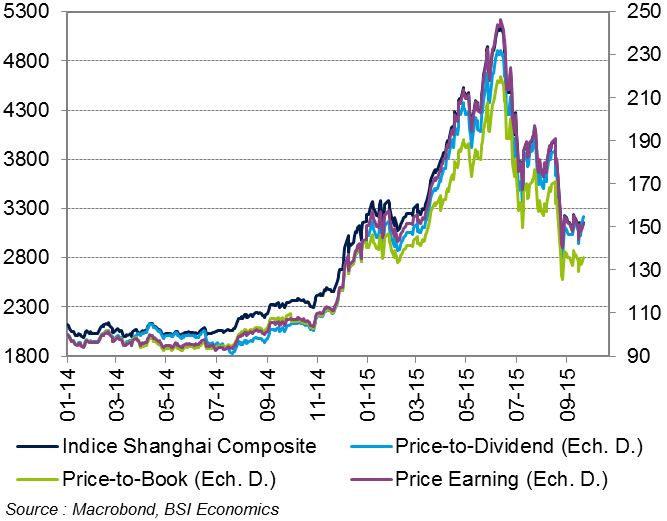
Judging by the Shanghai Composite Index and its valuation ratios, the rise was no longer sustainable. At its peak on June 12, 2015, valuation ratios, like the index price, reached record highs (see chart below). The bursting of the » 2015 PBoC » bubble took place over several trading sessions and a relatively long period of about three months. Like an earthquake, after an 11.5% decline in the week of June 15-19, 2015, several strong aftershocks followed. By July 8, 2015, nearly one-third of the Shanghai Composite Index’s capitalization had evaporated. The same was true for the Shenzhen Composite Index. But the decline did not stop there: on Monday, July 27, the index lost 8.5%, as it did on Monday, August 24. These » Black Mondays » represent the two largest declines in the index since the 2007-08 financial crisis. Finally, on August 25, the index lost another 7.6% to finish below 3,000 points.
Shanghai Composite Index and valuation ratios (100 = January 1, 2014)
The triggers for these serial declines :
The first drop of 11.5% in one week could be attributed to a combination of poor economic statistics and the ineffectiveness of the measures taken by the Chinese authorities. More broadly, the bursting of the bubble was inevitable and no real catalyst was needed for it to happen.
However, caught off guard by the scale of the decline, the central government hastily implemented a series of support measures, triggering a crisis of confidence:
– The number of short-term sales was reduced;
– Initial public offerings were banned;
– Credit lines were offered to brokers to enable them to continue acquiring securities;
– Chinese mutual funds and pension funds committed to acquiring more securities;
– Media outlets controlled by the Chinese authorities continued to broadcast positive news, encouraging citizens to acquire more and more securities;
– Institutional investors were prohibited from selling securities;
– Trading in several securities was suspended.
– Short sellers were threatened with imprisonment.
– Confidence was quickly lost and sessions ending in the red became more frequent.
On July 7, 2015, the Shanghai Stock Exchange banned trading in approximately 70% of its securities, freezing capital valued at USD 2.6 trillion, which represented approximately 40% of the value of all outstanding securities. However, less than 20% of household assets are invested in the stock market, which suggests that the Chinese economy will remain relatively unaffected by this stock market crash.
Finally, between August 11 and 14, 2015, China carried out successive devaluations of the yuan against the US dollar, bringing the devaluation to around 3.5%. This was followed by a wave of panic on global markets, with the VIX, to name but one example, rising to 40.7 at the close of » Black Monday » on August 24, 2015, compared with 13.8 at its peak on June 12, 2015.
The effects of the bubble bursting: not as systemic as one might think…
Effects on equity markets:
On global stock markets, the contagion was short-lived but intense. Between June 15 and August 24, 2015, the MSCI World Index, which, contrary to what one might think, only reflects the aggregate performance of developed markets, lost nearly 11%. Their emerging market counterparts lost more than 16% over the same period.
Effects on foreign exchange markets :
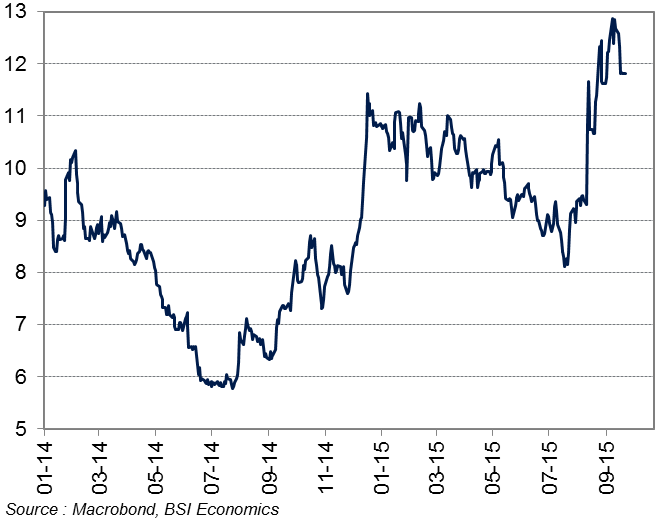
Another asset class experienced a sharp spike in volatility: emerging market currencies. According to the VXY-EM volatility index calculated by JP Morgan, volatility rose by nearly 40%, peaking at 12.85 on September 10, 2015 (see chart below). To name but a few, Asian emerging market currencies lost heavily against the dollar: the Indian rupee, Korean won, Singapore dollar, and Taiwan dollar fell between 3.5% and nearly 7% during the » 2015 PBoC » outbreak.
Commodity currencies also recorded heavy losses amid slowing Chinese demand: the Australian and New Zealand dollars lost between 7% and 8%, while the Brazilian real lost 12% over the same period.
VXY-EM index of emerging market currency volatility
Effects on commodity markets:
The Bloomberg Commodity Index, which aggregates 22 strategic commodities (oil, gas, gold, copper, wheat, corn, sugar, livestock, cotton, etc.), has fallen by up to 16% since its peak on June 12, 2015, reaching its lowest level since May 2009. In the case of oil, Brent crude lost up to a third of its value over the same period, reaching a low since March 2009 at USD 42.5. It even traded below USD 40 during the » Black Monday » session on August 24.
Effects on confidence:
However, beyond the financial turmoil surrounding the bursting of the » 2015 PBoC » bubble, the effects remained limited in developed markets. Indeed, this rational bubble was, from its creation to its bursting, the result of domestic pressures. Foreign investors have had only limited access to Chinese markets, even though these markets have become more liberalized in recent years. The losses associated with the bursting of this bubble, estimated at nearly USD 4 trillion, were mainly borne by domestic investors, particularly Chinese households. That said, the Chinese people’s colossal excess savings could absorb these losses without creating a cascade of defaults, for the time being… Returning to developed markets, it is more the uncertainty surrounding the effects of an even sharper slowdown in the Chinese economy (hard landing) that is undermining international investor confidence.
Conclusion:
This » 2015 PBoC » is part of a long line of so-called rational bubbles, in the sense that its formation was long and extensive and its bursting was more than predictable, with only the exact date being debated. This textbook case, however, is unique in that it is the result of domestic pressures. Furthermore, the limited openness of Chinese equity markets to international investors helped to limit contagion to developed countries. Although uncertainty surrounding the structural slowdown in the Chinese economy is likely to persist, the worst of the purge is behind us and this memorable » 2015 PBoC » has increased the likelihood that the next crisis will originate in China.
Emerging Asia, which has long been one of the engines of global growth, is slowing in the wake of the Chinese giant. Commodity prices are likely to remain low for some time amid declining demand and abundant supply. The global economy is sinking further into a form of secular stagnation.
Bibliography:
– Blanchard, O. and M. Watson, 1982, “Bubbles, Rational Expectations, and Financial Markets,” NBER Working Paper No. 945, pp. 1-28, July.
– Shiller, R. J., 1981, “Do Stock Prices Move Too Much to be Justified by Subsequent Changes in Dividends?,” American Economic Review, Vol. 71(3), pp. 421-436, June.
References:
[1] In China, there are two main stock exchanges, one in Shanghai and the other in Shenzhen. Both are composed of A-shares and B-shares. The key distinction is that A-shares are denominated in yuan, while B-shares are denominated in US dollars in Shanghai and Hong Kong dollars in Shenzhen (also known as H-shares). For a long time, the other main distinction was that the A-share market was closed to foreign investors, while the B-share market was open to them. This regulation has tended to relax in recent years.