Summary:
– France and Europe are two important pillars of global agricultural production.
– France is the eighth largest agricultural power in terms of its share of global agricultural production value.
– Europe is the world’s leading agricultural power when both the value of production and the share of the working population involved in production are taken into account.
– Europe’s agricultural trade balance, although unstable, is close to equilibrium compared to that of the US.
– France’s agricultural trade balance is becoming increasingly unbalanced.
France is a major agricultural power, just like other European countries, but it is difficult to determine France’s or the EU’s position in international production, or to know which types of food we produce in the greatest quantities. We propose to do so here by taking into account the value of production. Agriculture is a sector that produces a wide variety of goods, so their production can only be compared in monetary terms. It is measured here in thousands of international dollars (i.e., in purchasing power parity) and is taken from the FAO database [1].
The world produced a net agricultural value of $2.2 trillion in 2012 out of a global GDP of nearly $96 trillion (according to the World Bank). This value is obtained by multiplying the producer price (i.e., the price of the commodity when it leaves the farm) by the quantity produced. Thus, agriculture represents barely 2.3% of the value of annual production. However, this representation greatly distorts the importance of agriculture because it does not take into account the real service it provides: feeding people. It cannot be repeated often enough: a country cannot develop properly without a strong agricultural sector.
All developed countries have intensive agriculture, with the highest yields in the world for the vast majority of crops and products. Over the last two to three centuries, this has enabled them to gradually generate a surplus of workers and purchasing power, which has shifted economic activity towards industry and then services. Today, what is our position in this area? Are we still the largest producers? What do we produce? What do we export? What is the position of the European Union?
French and European production worldwide
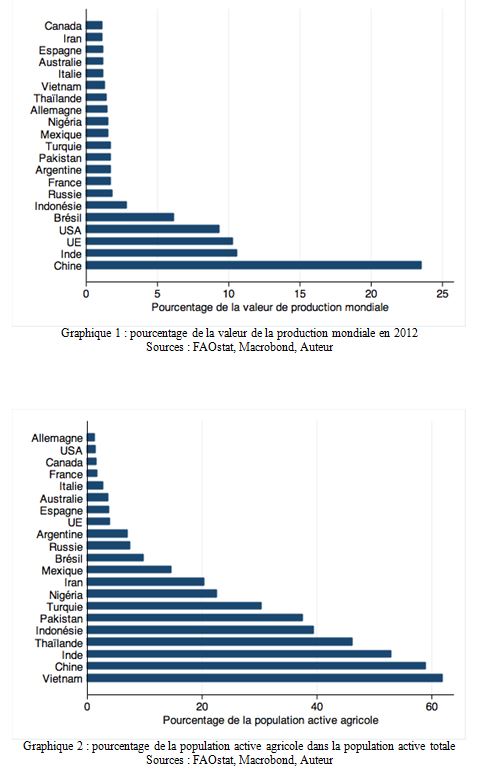
French agriculture is well ahead of the world’s largest agricultural producers, as shown in Figure 1 below. Covering an area of 670,000 square kilometers, it produces 1.7% of the world’s agricultural value, roughly the same as Russia, which has a territory more than 25 times larger. This performance is of course due to the historical organization of the territory, but also to the CAP (Common Agricultural Policy) and the presence of good quality arable land. According to the Ministry of Agriculture, France’s usable agricultural area (UAA, i.e., the land actually devoted to agriculture) in 2011 was approximately 325,000 square kilometers, while Russia’s was approximately 2.2 million. This latter comparison puts the first one into perspective, but it still shows how productive French agriculture is, since Russia’s UAA is nearly seven times higher than France’s.
Furthermore, according to the FAO, only 1.8% of the French working population was employed in the agricultural sector in 2013. This contrasts sharply with China, which produces nearly 25% of the world’s agricultural value, but whose agricultural sector employs nearly 60% of the working population. The difference with Russia remains striking, as its agricultural sector employs around 7.5% of the working population. This is further proof of the high productivity of French agriculture compared to other major agricultural countries.
In 2012, the European Union as a whole was the world’s third largest agricultural power, producing more than 10% of global production value. Of the 21 countries each representing more than 1% of this value, no fewer than four are European (Spain, Italy, Germany, and France). This performance is associated with a low share of the agricultural workforce, as barely 4% of the EU’s working population was employed in the agricultural sector in 2013. This level is low compared to India or China, but relatively high compared to the US (around 1.4%) or even France alone. This is because in some European countries a larger share of the population still works in the agricultural sector (Estonia 8%, Greece 10%, Hungary 6%, Latvia 8.5%, Lithuania 7%, Poland 15.8%, Portugal 8.6%, Romania 7.9%, and Slovakia 6.5%).
France among developed European countries…
Taking into account the two criteria in graphs 1 and 2, we can see that France is by far the leading European agricultural country. It produced nearly 17% of European agricultural value in 2012, compared with only 14.4% for Germany, 11.9% for Italy, and 11.7% for Spain. Four other countries produce a significant share of agricultural value: Poland (7.8%), the United Kingdom (6.8%), the Netherlands (5.8%), and Romania (3.3%).
Although the CAP (Common Agricultural Policy) is attempting, despite numerous reforms, to bring agricultural models closer together, it is clear that the rich countries of the Union, including France, have an ultra-productive structure with a small proportion of the working population employed in the agricultural sector, while others, such as Poland, still have a developing country model. This does not prevent them from being major producers. Furthermore, the possibilities for cultivation, but above all the potential gains and yields, are so significant that France may not remain the leading European producer.
…And global: Canada, Australia, and the US
It is interesting to compare France with countries that have the same agricultural model, i.e., a productivist model with very high yields. Regardless of the agricultural activity in question, developed countries have the highest yields in the world (even in rice production, for example, where Spain, Italy, Japan, and especially the US exceed the yields of Vietnam and Thailand). Canada and Australia account for 1.1% and 1.2% of global agricultural value respectively, which is much lower than France, even though these countries have agricultural areas of approximately 68 and 425 million hectares respectively, while France has only around 30 million hectares [2].
However, comparing France’s agricultural power to that of the US is largely disproportionate. It is therefore more logical to make a comparison with the European Union as a whole. In this context, we note that the US produces $22 million less than the EU.
French and European production: what we produce…
Working from a macroeconomic perspective requires the use of aggregates that sometimes conceal a certain degree of heterogeneity. Thus, as we said earlier, the agricultural sector produces a wide variety of commodities, and it is interesting to know what products we are talking about when we say that France produces 1.7% of the world’s agricultural value.
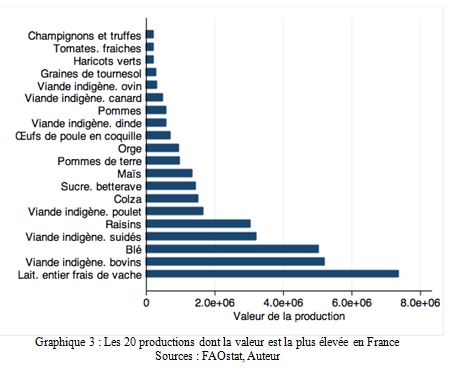
Figure 3 shows the 20 products with the highest total value. Cow’s milk, beef, wheat, pork, and grapes are the five largest products, in terms of value, in French agriculture. This is consistent with what one might expect about French production.
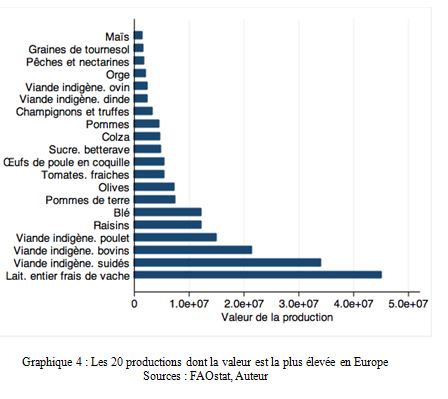
At the European level (Figure 4), the ranking does not change much. Milk production remains the activity that generates the most value, closely followed by meat production (pork, beef, and chicken) and then grapes. Wheat production ranks only sixth.
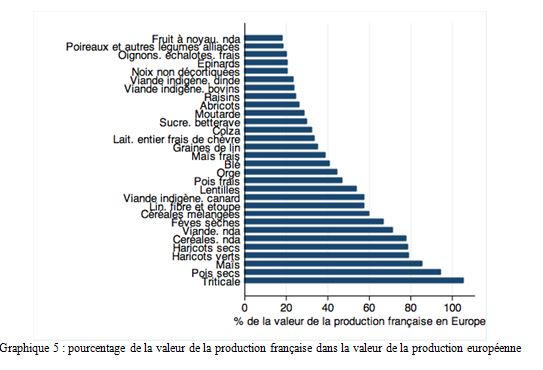
To put French production into perspective in relation to that of the EU, we have decided to present, in Figure 5, the percentage of French production value in European production. We can see that France produces 60 to 100% of European production of nine commodities: mixed cereals, dry beans, meat [3], cereals, dry beans, green beans, corn, dry peas, and triticale. The data appears to be skewed for triticale (which is a cereal widely used for animal feed). France also produces more than 40% of the European production value of wheat and barley. However, despite being among the most important production values, France produces only 20% of the European production value of beef.
…And what we trade
In terms of value
Trade in agricultural products involves both unprocessed commodities and agri-food products. As a result, the world trades in agricultural products worth nearly eight times the value of production. In 2011, trade reached nearly $18.35 trillion.
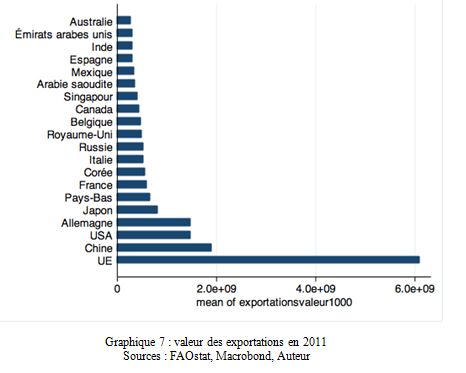
France exported around 3.9% of this value in 2011. This places it in sixth position among importing countries and seventh position among exporting countries. France, which is one of the largest producing countries, is therefore also a key player in the international food market. Europe can be considered the leading agricultural trading power, as it ranks first among importing and exporting countries with around 30% of the total value in 2011. The US accounts for only 12% of the value of global imports and 8% of exports.
Figures 6 and 7 below show that the world’s largest producers are, unsurprisingly, the largest trading powers. However, some countries are among the top 20 importing nations, such as Singapore, Korea, the Netherlands, and Japan. While the United Kingdom is not one of the largest producers, it also ranks among the 20 largest exporters, in 7th place. We also note the entry, on the export side, of the United Arab Emirates and Saudi Arabia, as well as the Netherlands. The latter exported nearly 3.6% of the value of global exports, or $667 billion in 2011, just ahead of France. Germany ranks fourth among both exporting and importing countries, with approximately $1.5 trillion in trade.
The Netherlands’ position as the leading agricultural trader among EU countries is probably distorted by international trade. The Netherlands is a point of arrival for many foodstuffs that are then redistributed throughout the EU.
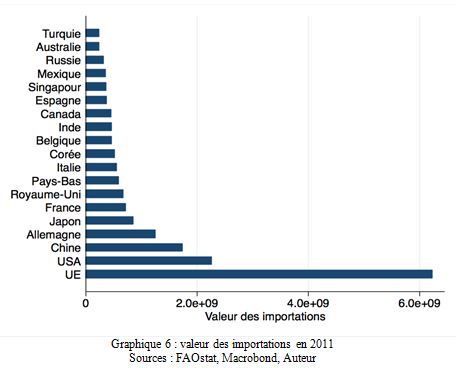
We can therefore see that France, although still very well placed here, is losing ground to other EU countries. While the value of imports depends primarily on consumer tastes [4], we note that French exports seem to suffer from either a lower level of added value or lower international demand than that of their direct competitors.
In terms of goods
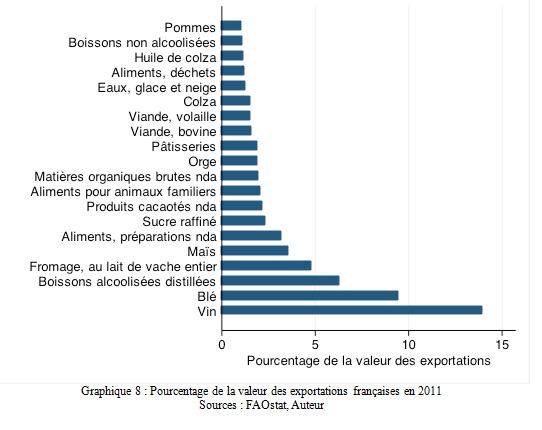
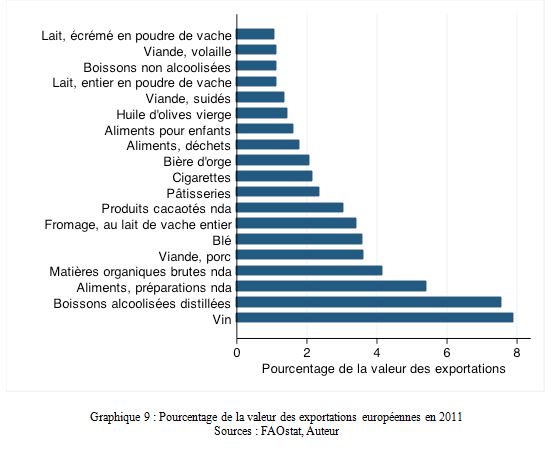
To understand French and European imports and exports in terms of goods, we propose to present the 20 products with the highest import and/or export value. In Figures 8 to 11 below, we show these products in terms of their share of the total value of French and European imports and exports (we use the EU-12 here to include only countries whose agricultural industry is comparable to that of France).
Unsurprisingly, France exports mainly wine and wheat, which accounted for nearly 15% and 10% of the total value of exports in 2011, respectively. The value of wine exports is also the highest in European agriculture, representing nearly 8% of the total value of exports, just ahead of other alcoholic beverages. Wheat and pork are in sixth and fifth place respectively.
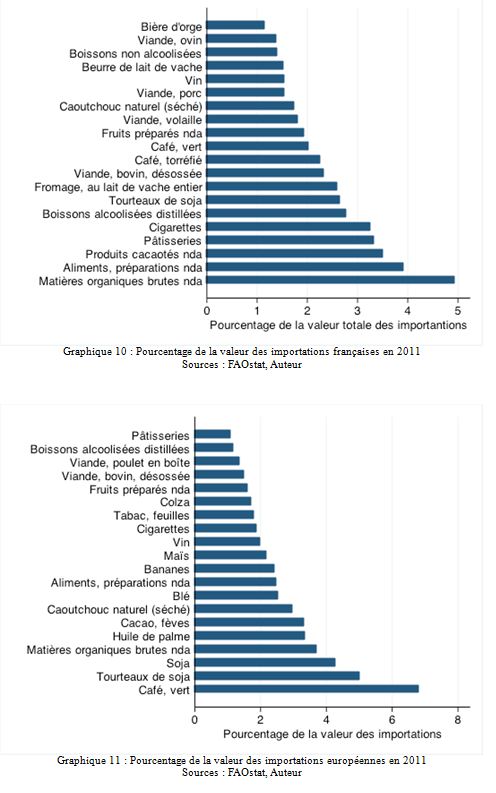
Graphs 10 and 11 show imports and reveal some surprising results. Indeed, we can see that the three largest French imports (in value) are raw organic materials n.e.s., prepared foods n.e.s., and cocoa products n.e.s. Raw organic materials include, for example, flower buds, branches, and stumps for plant materials, and feathers, horns, and intestines for animal materials. They are used in many sectors, such as perfumery and pharmaceuticals. Prepared foods represent all homogenized food preparations (such as soups, broths, and ketchup). We can see that we import many products that have already been processed, rather than simply agricultural raw materials. In addition, imported products represent more homogeneous levels of the total value of imports. Raw organic materials, the largest item of expenditure for imports, represent only 5% of the total value spent, whereas wine represented 15% of the total value exported.
Finally, Figure 11 shows that the EU imports primarily the same products as France, although the ranking is somewhat different. For example, the EU imports a lot of coffee and soybeans, which only appear in 10th and 7th place in French imports.
Evolution of the trade balances of France, Germany, the EU, and the US.
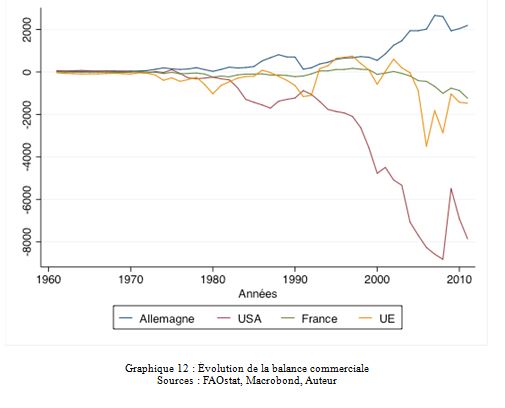
Looking at trade from a static perspective, as we have done so far, does not allow us to understand changes in the performance of countries’ agriculture. We therefore propose to visualize, using Figure 12, the evolution of the agricultural trade balance of France and the European Union compared to that of Germany and the US (comparable countries). We can see that the EU’s trade balance is fairly unstable and has been in significant deficit since 2004. The French balance follows this trend, albeit to a much lesser extent (although we note that the European trade balance improved at the end of the period). As with the rest of its economy, Germany’s agricultural trade balance is largely in surplus. It even reached $200 billion around 2010. Conversely, the US trade balance has been heavily in deficit since 1976, reaching a level of more than $800 billion in 2006, 2007, and 2008.
Analysis of this trend shows that European agriculture, although on a fragile slope, is much more competitive than American agriculture. There are probably many reasons for this performance, and much more precise and rigorous work would be needed to determine them. 10value added (such as wine) or that, thanks to the CAP, it has much higher yields than the US.
Conclusion
France and the European Union are therefore major agricultural powers. They are at the center of global production and ensure both a constant supply to markets and food security for most countries. With only a tiny proportion of their working population employed in the agricultural sector, they nevertheless manage to produce more value than the vast majority of their competitors. The leading French and European export is wine, yet France is not the leading European country in terms of international trade. As the last graph shows, Germany has a stronger export dynamic than France, with a large trade surplus.
As we said in the introduction to this article, the comparisons made here are difficult because the agricultural sector is extremely varied, but above all because the level of processing of products is very different between a commodity leaving the farm and a dish prepared by the agri-food industry. It would be interesting to make more precise comparisons, such as product-by-product comparisons.
Notes:
[1] FAO database: http://faostat.fao.org/site/291/default.aspx
[2] University of Toronto: www.g20.utoronto.ca/2011/2011-agriculture-chiffres.pdf
[3] « nda » means « not elsewhere specified » and refers to a category that includes many different types of products.
[4] We are in the agricultural sector, and the needs of this industry are marginal compared to the agri-food trade.