Summary:
• Negotiations to update the North American Free Trade Agreement (NAFTA) will likely continue into the first half of 2018.
• The US administration’s priority objective is to reduce the trade deficit;
• Mexico should find new markets for its exports in order to reduce its dependence on the US;
• The implementation of most-favored-nation tariffs on Mexican exports to the US has significant consequences.
The primary purpose of this note is to explain the current status of the NAFTA update process, based on a study of bilateral relations between the Mexican and US economies, both in terms of trade and finance. The second objective is to provide a quantitative response to the possible impact that the construction of barriers would have on Mexican imports [1].
A long and winding road
« NAFTA is probably the worst trade deal ever made, but it is certainly the worst deal made by this country. »
Donald Trump during the presidential debate with Hillary Clinton on September 26, 2016.
From the US elections to the current situation
Last year’s presidential elections in the United States marked a point of no return toward the opening of a process to update the North American Free Trade Agreement (NAFTA), which came into force in 1994. President Donald Trump focused much of his campaign on the promise of reducing the trade deficit with Mexico, relocating businesses, and bringing back jobs to the Rust Belt.
The proposals initially put forward by the new administration to achieve these goals were to withdraw from the treaty, impose very high tariffs, or implement border tax adjustments on Mexican exports. These plans not only violated the provisions of the treaty, but also contradicted World Trade Organization (WTO) rules. Initially, there was also talk of introducing measures that would hamper Mexican exports or discourage imports, such as new standards or taxes on US companies that have outsourced part of their production to Mexico.
Formal talks finally began in August, after Robert Lighthizer (U.S. Trade Representative) took office. The meetings were scheduled to conclude by the end of 2017. However, they will likely continue into the first half of 2018, approaching the Mexican general elections in July or the U.S. midterm elections in November. This may influence the pace of the discussions to some extent. According to recent polls for the upcoming Mexican general elections, the current president’s political party is not expected to seek another term. In this regard, Ildefonso Guajardo (Mexico’s Secretary of Economy) expressed his desire in the first week of October to reach an agreement in the first half of 2018.
During the second week of October, the fourth round of talks to update the treaty took place in Washington. The discussions were marked by recent tension caused by the US proposal to include a sunset clause. This provision would require the agreement to be renewed every five years. This proposal was not well received by the Canadian delegation, the Mexican delegation, the US Chamber of Commerce, or other US business associations. Following these latest events, the Mexican peso depreciated by 4.4% against the dollar in the first two weeks of October.
The U.S. trade deficit
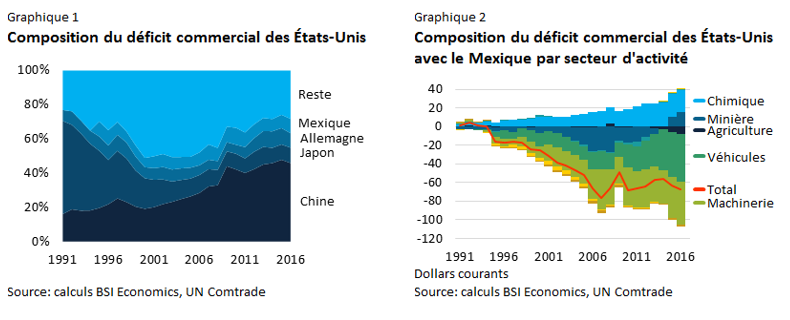
The US administration’s priority objective is to reduce the trade deficit with Mexico, which has been growing since 1994. On the Mexican side, I. Guajardo did not oppose reducing the trade surplus with the United States, provided that the correction was based on greater trade in goods and services and not on the adoption of tariffs or other restrictions.
Figure 1 shows the share of the four countries with which the United States has the largest trade deficit. The composition of the trade deficit with Mexico can be explored in Figure 2.

Made in the United States
One of the main requirements detailed by the United States is an increase in the percentage of North American components used in the manufacture of automobiles. In September, officials from the U.S. Department of Commerce shared the results of a study on this subject, which warned that the percentage of U.S. components used in the manufacture of automobiles in Mexico fell from 26.5% in 1995 to 18.1% in 2011. In this regard, Wilbur Ross (US Secretary of Commerce) proposed that, in order to avoid taxation, 50% of the final value of a car labeled as American must be manufactured domestically. Eduardo Solís (President of the Mexican Automotive Industry Association) responded shortly thereafter that studies conducted by his organization concluded that currently 39.5% of the final value of a car labeled as Mexican includes components manufactured in the United States. Finally, W. Ross also proposed that 85% of the final value of automobiles produced on the continent be North American-made, compared to the current 62.5%. This was motivated by the growing participation of third countries in automobile manufacturing in Mexico, which rose from 13.2% in 1995 to 29.5% in 2011.
The United States’ lower participation in its trading partner’s production process is also evident in the manufacturing industry as a whole. In this case, U.S. participation in Mexican manufacturing fell to 15% in 2011, compared to 21% in 1995.
What can we expect in the near future?
Issues likely to cause disagreement include changes to dispute resolution mechanisms, setting a limit on the number of contracts with the U.S. federal government that Mexican and Canadian companies can be awarded, and the working conditions of Mexican employees. However, R. Lighthizer has announced that talks on competition policy are at an advanced stage.
The Mexican administration has repeatedly stated that it would prefer not to sign any agreement if the terms are deemed unfavorable. During an appearance before the Mexican Senate in the second week of October, Luis Videgaray (Mexico’s Secretary of Foreign Affairs) stated that the treaty’s continuation would be conditional on the preservation of national interests. However, at an annual meeting of the International Monetary Fund, also held during the second week of October in Washington, Agustín Carstens (Governor of the Central Bank of Mexico) was positive, stating that he expected a satisfactory outcome from the negotiations that would make the agreement fair for all three countries. Nevertheless, the Mexican authorities are aware that, regardless of the final outcome of the talks, it is essential to find new markets for their exports in order to reduce their heavy dependence on their northern neighbor.
The working teams continue to make progress on drafting a new agreement, away from political rhetoric, negotiation tactics, and media exposure. Any changes to the terms of the agreement will have to be ratified by the parliaments of each of the three signatory countries. The treaty specifies that if a member country wishes to withdraw, it must first inform the other signatories of its intention and then wait six months before its decision can take effect.
The impact of trade barriers on Mexican imports
A close relationship
The treaty’s entry into force meant the elimination of almost all existing customs duties between the signatory countries. Previously, Mexican exports to the United States faced tariffs of 2.5% in the automotive sector, 3.1% in the automotive supply industry, 12% on agricultural products, and 17.9% in the textile sector. The treaty allowed companies to relocate their production to the North American continent in order to take advantage of the comparative advantages offered by each of the three economies.
Mexico recorded a trade surplus with the United States that reached $67.1 billion in 2016. The United States was the recipient of 81% of Mexican exports, down from the 83.4% average recorded since the treaty came into force. In relative terms, this figure represented 28.9% of Mexico’s gross domestic product (GDP). For its part, Mexico was the source of 13.2% of US imports, continuing an upward trend from the 7.3% recorded in 1994. This consolidated its position as the second largest exporter to the United States after China, surpassing Canada for the first time last year.
The Mexican economy accumulated 1.6% of US foreign direct investment (FDI) stock. In relative terms, this figure represented 8.4% of Mexican GDP. In terms of the breakdown of this data, manufacturing accounted for 33.8% of the total, non-bank holding companies 24.4%, mining 12.5%, and the financial sector 11%. However, Mexico has lost relevance in US FDI stock after peaking at 3.6% in 2001.
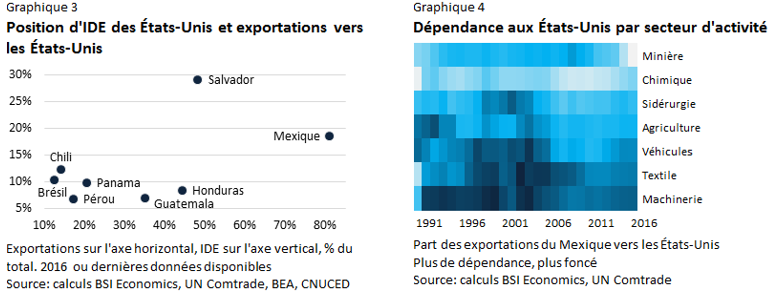
Figure 3 shows Mexico’s high dependence on the United States compared to other Latin American countries, both in terms of exports and FDI. The breakdown of exports shown in Figure 4 details the level of dependence of each Mexican industry on the United States.


Import demand
In order to obtain a detailed estimate of the impact of the implementation of customs duties on Mexican exports ofgoods to the United States, the losses associated with this trade barrier were calculated for different sectors of activity. The article by Kee, Nicita, and Olarreaga (2008) is the starting point. The paper analyzes the effects of these restrictions on production by estimating the elasticity of import demand. Their work is particularly interesting because of the large number of countries included, the high level of decomposition of traded products, and their classification in a recognized standardized system.
The elasticity of import demand is interpreted as the percentage change in the quantity of imports of a product when the price of that product increases by 1%, all other things being equal. In other words, this measure indicates how sensitive demand for an imported product is when its price increases, i.e., the quantity that is no longer purchased because its new price discourages consumers. The elasticities of U.S. import demand calculated by the authors indicate an average of -3.4 with a standard deviation of -1.1 and a weighted average of -1.3.
In their analysis, the authors identify four characteristics of import demand elasticity:
• first, homogeneous goods are more elastic than heterogeneous goods [2];
• second, the more production is broken down, the more elastic the demand for imports is.
• Third, large countries tend to have more elastic import demand, given the availability of domestic production substitutes.
• Fourth, more developed countries tend to have less elastic demand for imports, mainly because of the greater presence of heterogeneous goods in their demand for imports.
Which sectors would be most affected?
It should be noted that both Mexico and the United States are the countries with the highest losses associated with the adoption of tariffs in the exercise presented by the authors. Due to Mexico’s heavy dependence on exports to the United States, the elasticity of US import demand can be taken as a good first approximation to calculate the effects that facing higher export costs to the United States could have on the Mexican economy.
If trade relations between Mexico and the United States were no longer governed by the current treaty, as members of the WTO, both countries would have to apply the most-favored-nation clause. This clause stipulates that a WTO member country cannot impose more restrictions than those already imposed on a third country with which it has signed a trade agreement. This legislation is based on the fundamental principles of international trade of reciprocity and non-discrimination.
The exercise carried out for this note is static in nature, i.e., the estimate assumes that events take place at a single point in time [3]. Losses were calculated for 2018 assuming that the adoption of customs duties takes effect on the first day of the year. These customs duties correspond to those of the WTO’s most-favored-nation clause. The current trade profile of the United States would imply a weighted average rate of 3.3%. The results obtained are sorted by sector of activity using the same classification constructed for this note. The units were converted into real dollars based on the year 2010. To do this, it was necessary to estimate deflator forecasts.
Vehicle exports would suffer the most, with a loss of $3.1 billion, followed by machinery ($2.9 billion) and agriculture ($2.5 billion). To a lesser extent, textile exports would decline by $0.7 billion, while chemical and steel products would decline by $0.5 billion each. Finally, mining exports would be reduced by $0.1 billion. In relative terms, these figures represent losses of 3.6%, 1.8%, 9%, 11.2%, 4.5%, 3%, and 0.8%, respectively.
These results should not obscure the bigger picture. The reality is that certain products would face customs duties that would be clearly impossible to bear. As a result, exports of these products would disappear completely. This gives an idea of the overexposure of different sectors of activity, highlighting significant vulnerabilities to various shocks or changes in the economic cycle.
Conclusion
The US trade deficit does not stem from the free trade agreement, but from macroeconomic imbalances such as those arising from a country that saves less than it invests. On the other hand, international trade does not necessarily have to be a zero-sum game. Unfortunately, these widely held ideas do not seem to have found their way into the negotiations.
The talks will continue to follow a long and winding road in order to avoid creating trade barriers where none exist. As we have been able to show quantitatively, failure to reach an agreement could be costly.
References:
Kee, Hiau L., Alessandro Nicita, and Marcelo Olarreaga. 2008. “Import Demand Elasticities and Trade Distortions,” The Review of Economics and Statistics, MIT Press, 90(4): 666-682.
[1] The note contains forecasts estimated from IMF and FRED data. Unless otherwise indicated, international trade data were extracted from UN Comtrade and investment data from UNCTAD and the BEA. Finally, tariff data were consulted at the WTO.
[2] Homogeneous products are perfect substitutes, so consumers will differentiate between products in terms of price rather than their characteristics. The authors calculated for their exercise that mining and agricultural products are the most elastic, while vehicles and machinery (commonly considered heterogeneous goods) are the least elastic.
[3] However, a dynamic formulation that also includes other factors relevant to the analysis could describe the response process over time implied by the shock of adopting tariffs. Nevertheless, the results can be interpreted as the worst-case scenario, all other things being equal.