Summary:
– Long-term US sovereign bond yields rose during 2013, particularly from May 2013 onwards.
– This rise, which followed changes in the Fed’s monetary policy, appears to be the result of an increase in the term premium.
– In the current transition period, the challenge for the Fed is to maintain control over the short end of the yield curve in order to ensure financing conditions that are in line with the US economy.
Changes in US interest rates, particularly long-term interest rates, have been a significant part of economic and financial news in 2013 and early 2014. This is mainly due to the importance of US monetary policy and the actions of the Federal Reserve (Fed) in the economic system and international financial markets in the aftermath of the crisis. This article attempts to shed light on the movements observed on the long end of the yield curve since May 2013.
1 – Interest rates can be broken down into different components, which makes it easier to understand the mechanisms at work.
In order to better understand the ins and outs of bond rate movements, it is important to first understand what their components are.
According to the Expectation Hypothesis, the rate on a long-term security can be understood as the sum of a short-term rate (covering the entire duration of the long-term bond) and a term premium.[1]. This breakdown can itself be clarified by the more traditional breakdown of nominal interest rates, without however exhausting the subject.
Nominal long-term rates are the sum of real long-term rates and inflation over the period in question.These two elements can be further broken down into sub-components:
– For real long-term rates: It is possible to distinguish between the product of real short-term rates and a risk premium. The latter represents, in particular, interest rate risk (risks related to changes in interest rates over the period).
– For inflation: A distinction must be made between inflation expectations over the period covered by the bond until maturity and an inflation risk premium (unanticipated change in inflation).
The two premiums (interest rate and inflation risks) make up the bulk of the term premium, which also includes other elements. This breakdown therefore disregards other elements such as the liquidity premium and certain technical premiums linked to the functioning of financial markets. For the sake of completeness, liquidity premiums (the longer the maturity, the less liquid the market) and premiums specific to the functioning of different markets (off-the-run/on-the-run bonds) should also be added.[2], specific regulatory standards, differentiated credit risk trends depending on maturity, which can lead to temporary inversions of the yield curve, etc.).
Quantitative easing programs have reduced the volatility of the various components and thus reduced the term premium. The implementation of tapering has coincided with a return of volatility to the bond markets, which may also help explain the rise in the term premium on US bonds (for more on the transmission channels of tapering, see our recent insight here).
2 – Changes in US sovereign rates since May 2013
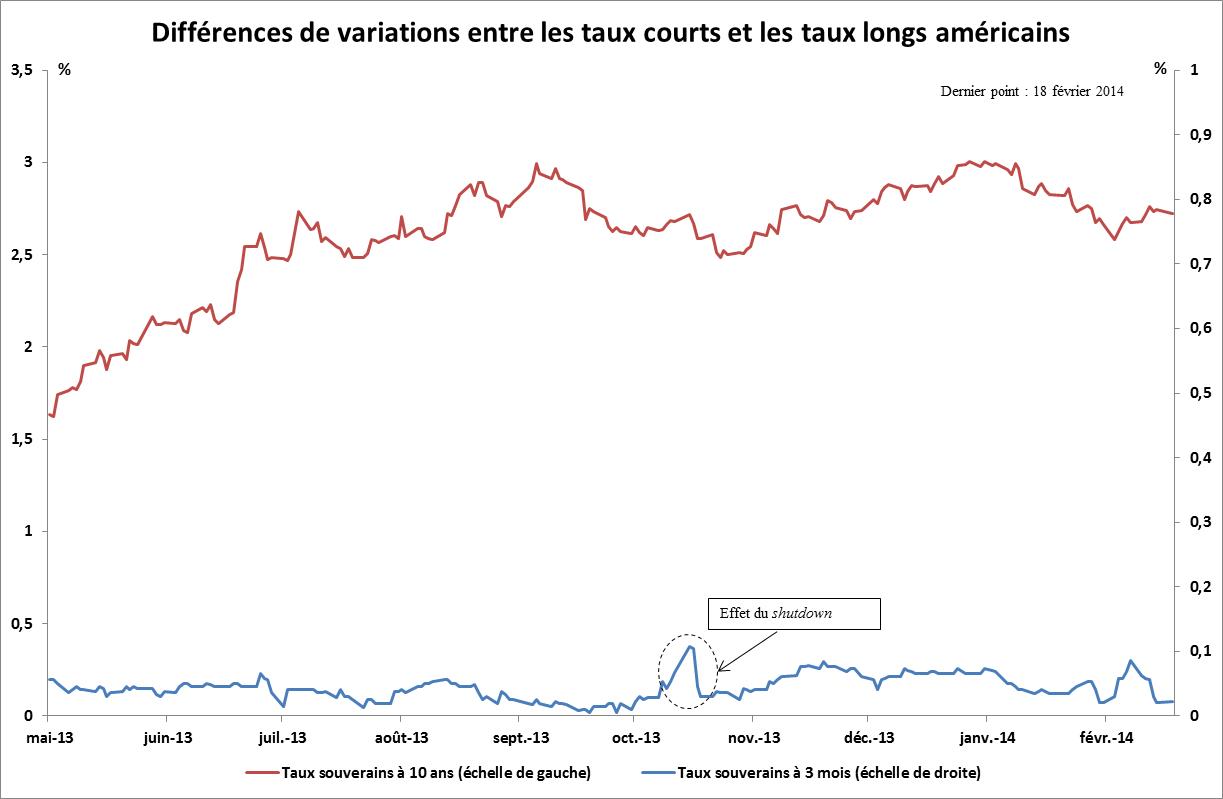
US long-term interest rates (10-year) rose by 137 basis points between May1 and December 31, 2013.The Fed’s initial announcements regarding an upcoming slowdown in its securities purchase program[3](QE 3) in spring 2013 triggered a period of rising US long-term rates. The monetary authorities, notably Fed Chairman Ben Bernanke, then issued statements reminding the public that the highly accommodative unconventional monetary policy measures then in place would only be implemented for a limited period and would certainly be phased out before the end of 2013. These announcements were motivated by the improvement in the economic situation and the increase in perceived risks in certain segments of the financial markets. However, while short-term interest rates depend mainly on central bank policy rates, long-term rates are set on the financial markets, which are influenced by developments in operations involving the size of central bank balance sheets, as is the case with QE3.
BetweenMay 1and September 17, 10-year sovereign rates rose by 122 basis points (bps) – from 1.63% to 2.85%. Market participants then anticipated a slowdown (tapering: » taper » means to decrease. Tapering is the term commonly used to describe the Fed’s reduction in asset purchases) of its securities purchase program, a decision that was ultimately not taken by the Fed at its Federal Open Market Committee (FOMC) meeting on September 17. This surprise decision can be explained in particular by doubts about the strength of the US recovery[4]and fears about tensions arising from the budget debates in the US Congress, which were tense at the time[5].
US long-term rates then eased by 36 basis points between September 18 and October 23 (to 2.49%) before rising again. This easing did not offset the previous increases and was even counterbalanced by positive surprises in the US economy, particularly in the employment figures.
A new, much more moderate phase of increases began on October 23 and lasted until December 18, when the Fed finally decided to announce tapering. Subsequently, rates remained stable at the end of the year, a period marked by low trading volumes on the markets (+8 bps between December 19 and 31, to 3.01%).
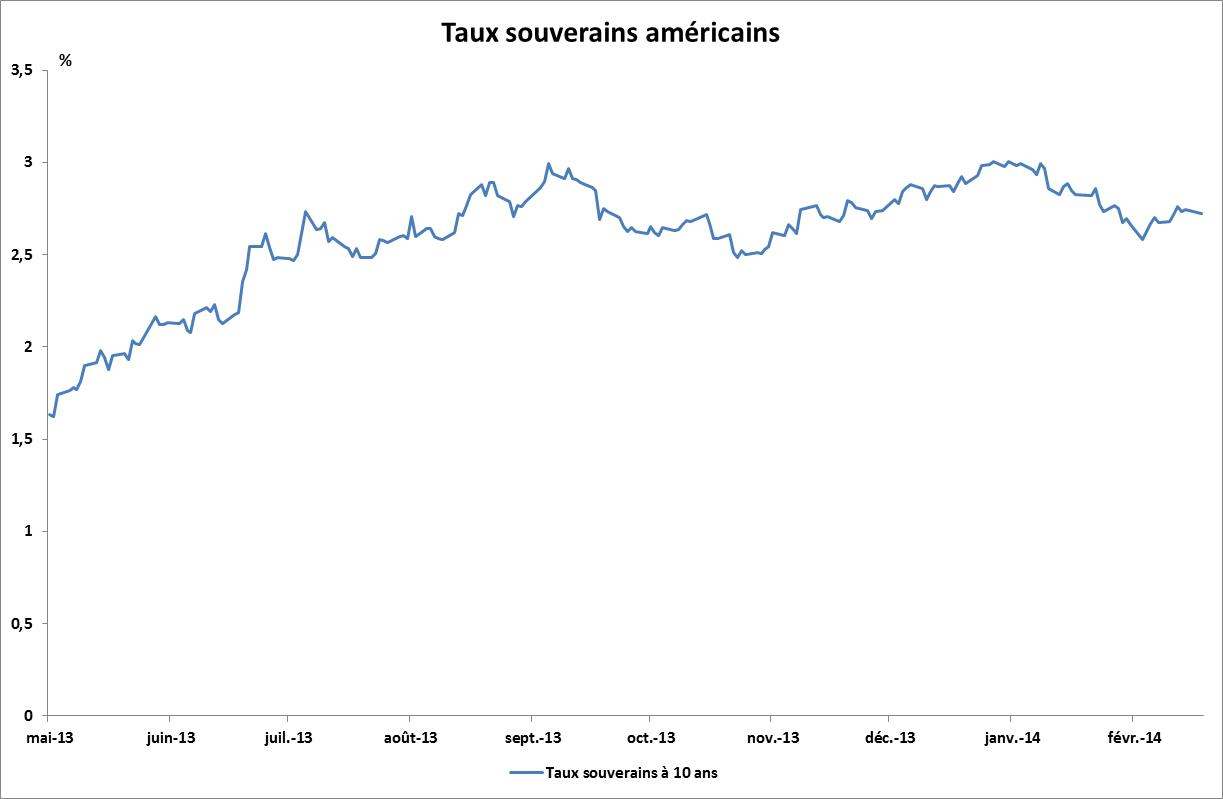
Sources: Macrobond, BSI Economics (last update: February 18, 2014)
The tapering announcementon December 18 was accompanied by a qualitative strengthening offorward guidance on future changes in key interest rates, aimed at limiting the rise in long-term interest rates.In its statement, the Fed specified that its key rates would remain at their current levels for longer than expected, « well past the time that the unemployment rate falls below 6.5%. »[7]. In doing so, the Fed offset the upward impact on long-term rates caused by taperingby changing agents’ expectations, extending the period during which they anticipated key rates would remain at their lowest level. The US central bank thus maintained very accommodative monetary conditions despite the announcement of tapering[8]. The December 18 decision has since been confirmed and reinforced by the FOMC’s January 29, 2014 decision[9], despite tensions in emerging markets.
However, in January 2014, US long-term rates eased. Between January1 and February 4, US 10-year sovereign rates fell by 37 basis points to 2.62%. This decline may be the result of several factors. First, the combined effects of forward guidance and less buoyant economic news at the beginning of the year, particularly in China and the United States, may have pushed back expectations of a rise in short-term rates. Second, tensions in emerging financial markets[10]and rising risk aversion may have encouraged a flight to quality that favored US securities. The VIX rose by 6 points between January1 and February 4, from 14.2 to 20.0. The relative easing of tensions coincided with a rise in rates (+13 bps between February 4 and 20, to 2.76%).
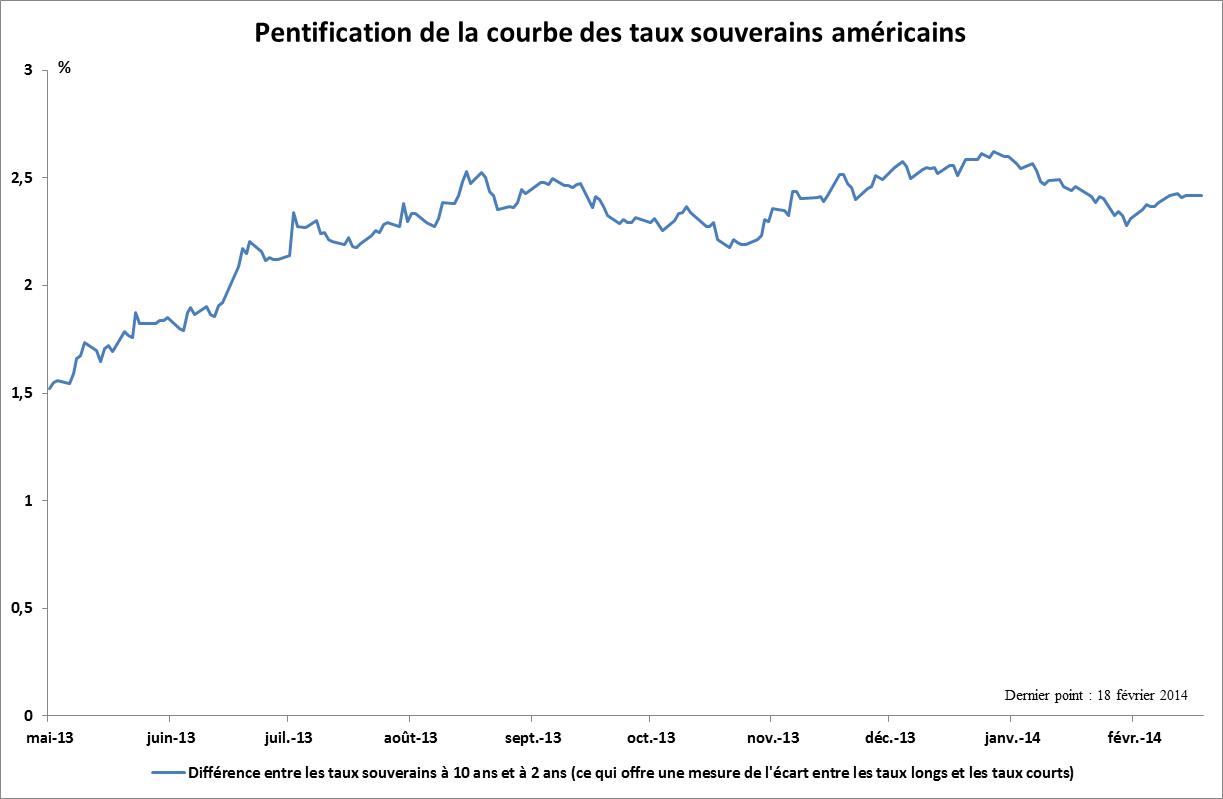
Furthermore, the Fed did not change its key rates during this period. US short-term rates therefore remained largely unchanged and close to their floor. This should continue to be the case throughout 2014.[11]given the US central bank’s use of forward guidance as a monetary policy tool. This has led to a steepening of the yield curve. With long-term rates rising and short-term rates remaining fixed, the spread between the two is bound to widen. This widening spread is reflected in a steeper yield curve.
However, as the tensions between the short and long ends of the yield curve cannot be too great – since short-term rates play a part in determining the value of long-term rates – this phenomenon limits the further rise in long-term rates observed in 2013.
Sources: Macrobond, BSI Economics
Sources: Macrobond, BSI Economics
3- Changes in the term premium were particularly decisive in determining the trajectory of interest rates over the period.
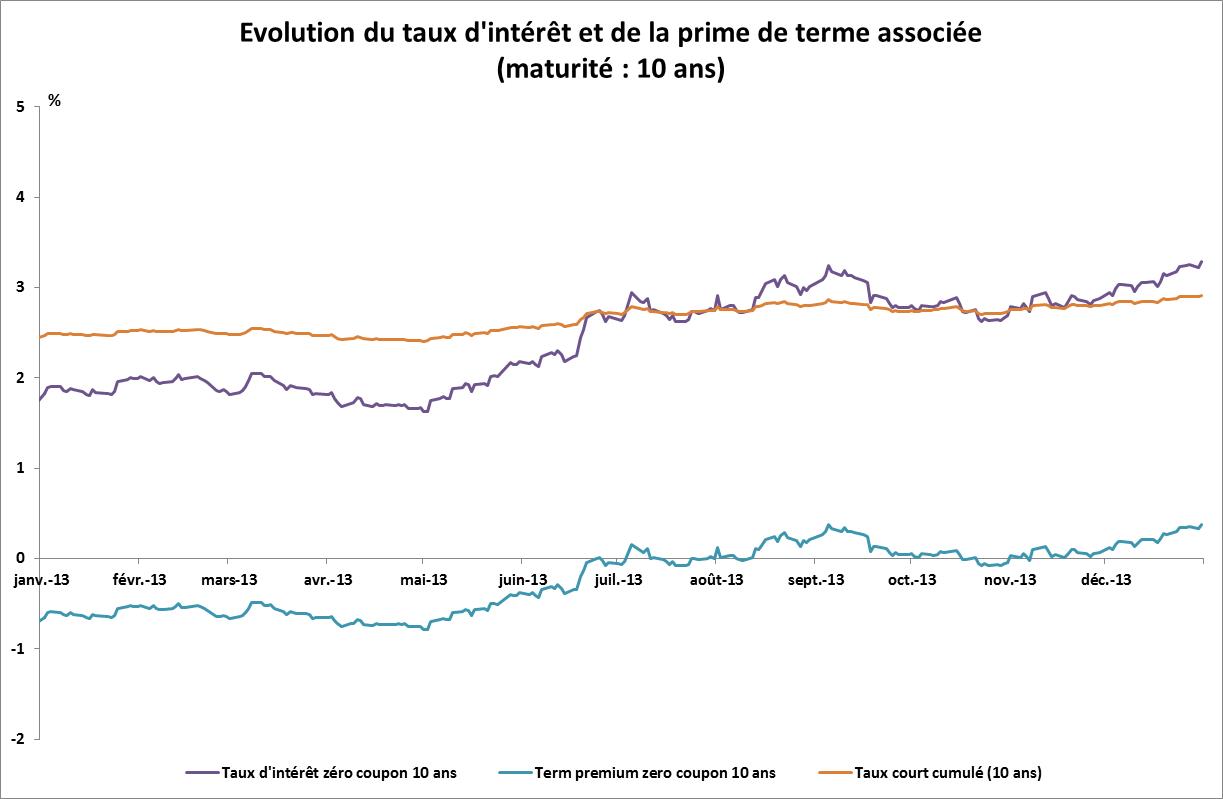
The rise in US rates observed over the summer appears to be largely due to an increase in the term premium. According to data obtained using a structural model of the US yield curve (Kim, 2005), this rise in long-term rates is mainly due to the associated term premium, which followed the same pattern: +103 bps betweenMay 1and September 17 (when it turned positive again and stood at 0.25%); -20 bps between September 17 and September 30, when it remained positive (0.04%). Despite a slight decrease, it nevertheless followed an upward trend until the end of the year (+32 bp betweenOctober 1and December 31 to 0.38%), i.e., +116 bp betweenMay 1and December 31.
Sources: Macrobond, BSI Economics
This variation can be seen across the entire yield curve, but to a lesser extent as maturity decreases. Thus, expectations of an end to QE3, which roiled the markets in the summer, precipitated the normalization of the term premium. The latter returned to positive territory after having been negative since 2011, due in particular to the scale of the unconventional monetary policy programs put in place (Caruana, 2013). Historically, the term premium is positive, which partly reflects the fact that it compensates investors for additional risk. The fact that it has reached negative territory highlights (i) the uncertainty that has marked the short-term US economic outlook since 2011 and (ii) the success—at least in this respect—of quantitative easing programs, which have compressed the term premium, notably by reducing rate volatility.[12]and reducing its liquidity premium component. Securities purchase programs would therefore have had a significant effect on this term premium. By helping to loosen the grip of monetary policy on long-term rates, and thus allowing volatility to return, tapering is contributing to an increase in the term premium. This effect is compounded by an upward impact on the liquidity premium.
From a certain point of view, the limited variation in long-term rates observed following the announcement of tapering can be interpreted in light of the already normalized term premium. This monetary policy decision was expected, and the rise in rates linked to a revaluation of the term premium has been ongoing throughout the year since May 2013. Thus, the actual announcement of tapering confirmed a movement that had already taken place. Nevertheless, some authors (Bauer, 2013) believe that traditional models (and in particular certain term structure models of the yield curve) tend to overestimate the importance of the term premium. While the exact share of the term premium in the evolution of nominal rates is therefore subject to caution, it still appears to be significant.
At the same time, the improvement in economic conditions during 2013 led to an increase in long-term rates, supporting expectations of a rise in short-term rates by 2015.Following positive US figures for both employment and economic activity in the summer and fall of 2013, expectations of a future rise in short-term rates, and therefore a tightening of monetary policy, materialized in the form of higher forward rates. Mechanically, this rise causes an increase in long-term rates through transmission along the yield curve. Thus, while the rise in the term premium mainly results in a steepening of the curve, this is a more general movement.[13]upward shift (parallel shift) following a positive shock to the economy.
Ultimately, the rise in interest rates is the result of various factors, relating both to the new monetary policy conditions and to the economic situation.
4 – The Fed’s control over the yield curve is crucial in the coming transition period
Until the FOMC meeting on September 17 and 18, 2013, 10-year interest rates rose sharply, leading several observers, including the Bank for International Settlements, to point out that the tightening of financing conditions was more the result of market forces than of monetary authorities (BIS, 2013). This observation highlights the difficulties that different central banks may have in setting the desired monetary conditions, an effect that may be reinforced by future divergences in the monetary policies pursued by the central banks of developed economies.
By emphasizing the strengthening of its forward guidance, the Fed is insisting that the reduction in securities purchases is the beginning of a normalization of its tools and not a tightening of US monetary policy. Some observers even felt that the Fed’s monetary policy was in fact more accommodative after this decision than before the tapering announcement. This may explain, in part, the decline in rates observed since the beginning of the year, while trading volumes on the markets have returned to higher levels since the end of the year. Furthermore, this approach tends to validate the conclusions of economists who argue that forward guidance and the management of expectations have had a greater impact than asset purchase programs, especially as the marginal effectiveness of these programs has tended to decline as their use has become more widespread (Curdia, 2013 and Woodford, 2012).
The US central bank must therefore manage this transition towards the end of quantitative easing by maintaining the monetary and financing conditions it considers appropriate for the US economic situation. To do so, the Fed has several instruments at its disposal, some of which are currently under development, but it must nevertheless ensure that it retains its power of persuasion with the financial markets. Furthermore, the effects of these changes on international markets could complicate its decision-making.
Conclusion
Thus, the spread between short-term and long-term rates remains partly constrained by expectations of short-term rate movements. Unless the credibility of the Fed and its forward guidance is called into question by the markets, long-term rates cannot rise too far above the levels reached this summer, given that short-term rates are fixed. While improvements in the economic situation are being closely monitored and will affect future rates, controlling expectations about short-term rate movements therefore remains crucial to the Fed’s future strategy.
Notes:
[1]A premium that rewards investors who agree to hold long-term securities rather than renewing investments in short-term securities.
[2]In certain markets, such as the US sovereign bond market, there is a price differential between the latest bonds issued for a given maturity (on-the-run) and those issued previously (off-the-run). This premium is similar in many ways to a traditional liquidity premium, with on-the-run bonds being the most liquid.
[3]Third Quantitative Easing program, initially consisting of monthly purchases of $45 billion in (long-term) US Treasury securities and $40 billion in MBS, for a total of $85 billion.
[4]These doubts were compounded by the perception that the economic recovery was fragile, which the sensitivity of US mortgage rates to sovereign rates could have jeopardized.
[5]Indeed, budget discussions in Congress led to a shutdown of some federal services onOctober 1, which was only resolved on October 16 following a minimal agreement .
[6]While the program initially consisted of monthly purchases of $85 billion, these monthly purchases were set at $75 billion, with the decline divided equally between sovereign bonds and MBS (-$5 billion each). This slowdown in monthly purchases effectively began in January 2014.
[7]Whereas the Fed had previously predicted that these rates « would be appropriate at least as long as » the unemployment and inflation thresholds were not exceeded.
[8]Some observers even argued that the Fed’s monetary policy was more accommodative after this decision than before the tapering announcement .
[9]Monthly purchases, starting in February 2014, will now total $65 billion. Further slowdowns are anticipated at future FOMC meetings in 2014, depending in particular on market reactions.
[10]In January, sharp depreciation occurred in Turkey (-6% against the USD), South Africa (-6%), Russia (-5%), Hungary (-6%), and Brazil (-3%). Political risks in Ukraine also increased significantly.
[11]The consensus market expectation is for key interest rates to rise around mid-2015.
[12]The volatility of inflation expectations has also declined over the long term, particularly as a result of central banks targeting inflation.
[13]Although not necessarily uniform, as shown by the example of the 1994 tightening, when long-term rates rose more than estimated ex ante.
Bibliography
Bauer, M. D., Rudebusch, G. D., and Wu, J. C. (2013), Comment on ‘Term Premia and Inflation Uncertainty: Empirical Evidence from an International Dataset’, American Economic Review.
BIS Quarterly, September 2013
Caruana J., Debt, Global Liquidity and the Challenge of Exit, BIS , July 2013
Curdia, V and Ferrero, A, How Stimulatory are Large-Scale Asset Purchases?, FRBSF Economic Letter, August 12, 2013
Kim, D. H. and Wright J. H. (2005), An Arbitrage-Free Three-Factor Term Structure Model and the Recent Behavior of Long-Term Yields and Distant-Horizon Forward Rates, Finance and Economics Discussion Series. The data from this model are available online on the Fed’s website.
Woodford, M. (2012), Methods of Policy Accommodation at the Interest-Rate Lower Bound