The tension between tightening and tapering: The importance of the short end of the yield curve
Summary:
– Improving economic conditions in the United States justify expectations of a short-term slowdown in the Fed’s securities purchase program.
– Such a development is likely to have a significant impact on the yield curve, particularly on the long end.
– The effectiveness of future US monetary policy will therefore depend in part on the Fed’s ability to act separately on the short and long ends of the yield curve, which requires a good understanding of its tools.
– These developments pose risks for financial markets, which have benefited fully from liquidity inflows and whose resilience has not yet been tested.
Following the improvement in economic conditions in the United States in recent months [1] and more proactive communication from the US central bank (Fed), aimed at emphasizing the conditionality of unconventional monetary policies and their possible withdrawal, the slowdown in the Fed’s asset purchase program (Quantitative Easing 3 or QE 3) remains a pressing issue.
While it is still too early to assess all of its impacts, particularly the macroeconomic ones, it is clear that this program has become a crucial factor in financial market dynamics. This is evidenced by the significant, even brutal, adjustments in the bond markets in the summer of 2013, both in the United States and in other developed and emerging economies (Charts 1 and 2).
Chart 1:
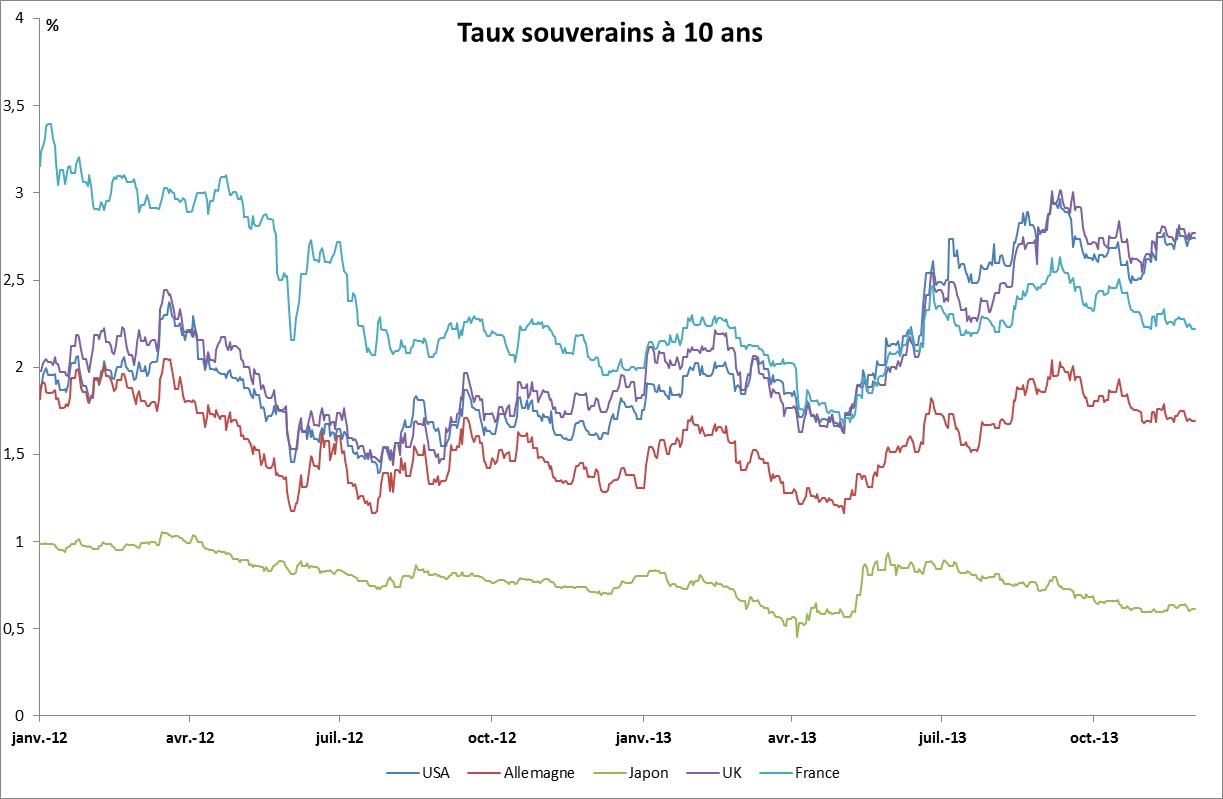
Source: BSI Economics, Macrobond, last update: 12/01/2013
Chart 2:
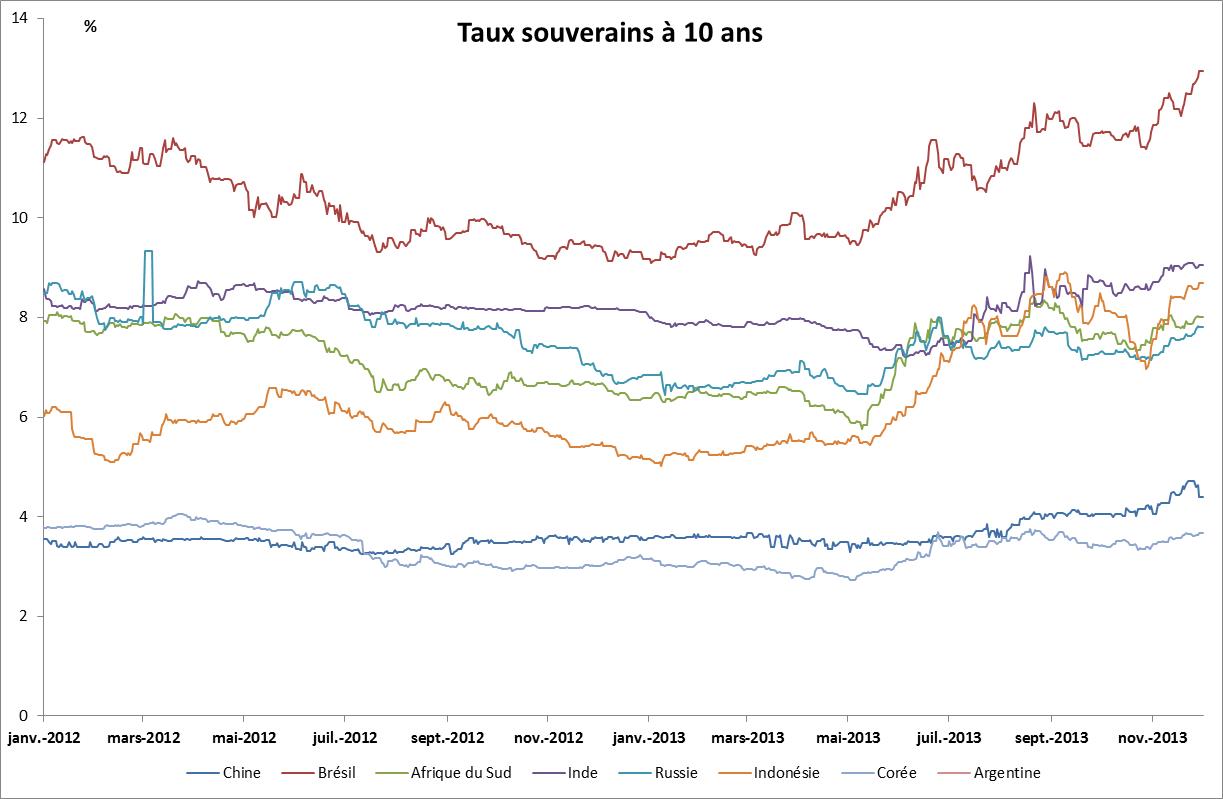
Source: BSI Economics, Macrobond, latest data: 12/01/2013
Admittedly, market participants’ expectations regarding the precise timing of the slowdown and the terms of the withdrawal differ, but they agree on an imminent withdrawal, most likely during the first quarter of 2014. This article does not seek to take sides on the timing of the QE3 slowdown, but rather attempts to highlight the difference between this slowdown (tapering) and a tightening of monetary policy following an increase in the Fed’s key interest rates (tightening). Since early 2009, key rates have been at azero lower bound, and the terms of their rise remain a complex issue.
The various quantitative easing programs, particularly QE3, have mainly affected the long end of the yield curve (an explanatory article on the yield curve is available on the BSi Economics website), for example on 10-year sovereign rates (Chart 3), and have been transmitted to the economy as a whole through various channels.
Chart 3:
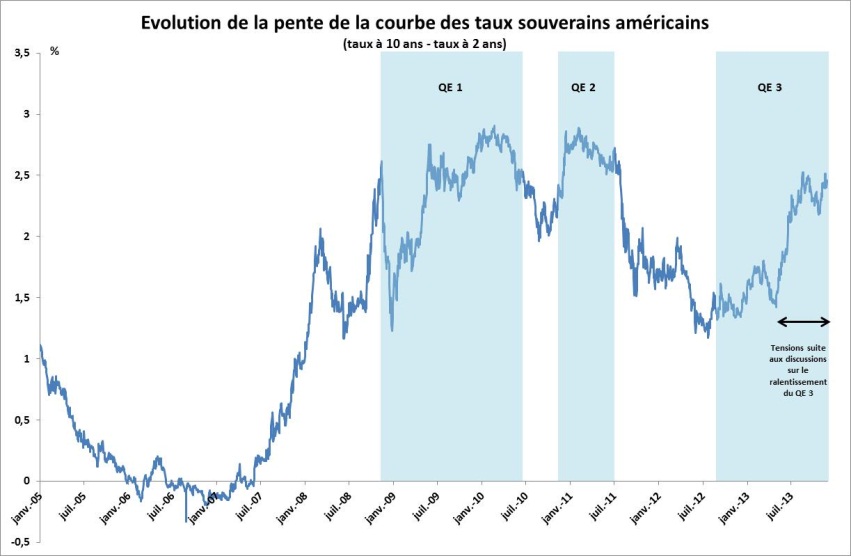
Source: BSI Economics, Macrobond, last point: 12/01/2013
Firstly, these programs led to a rebalancing of agents’ portfolios following a sharp rise in demand for US Treasury bonds – with varying degrees of importance depending on maturity, but stronger at the long end of the yield curve, particularly following the Twist program ( Maturity Extension Program) – leading to a decline in expected returns on these securities. Furthermore, these purchases, mainly through a reduction in interest rate volatility, contributed to the weakening of the term premium, which estimates show has been below its historical average, or even negative, in recent years (Chart 4 ).
Chart 4:
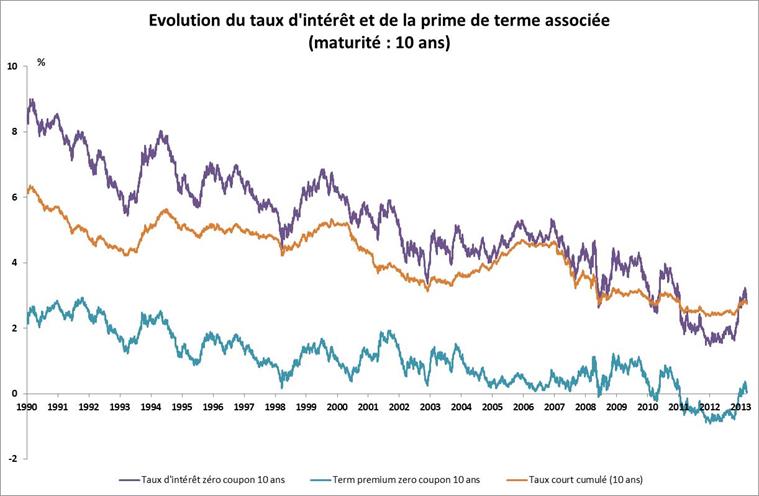
Source: BSI Economics, Federal Reserve, Macrobond, last point: 09/30/2013)
Monetary policy has also been transmitted through a signaling effect, with these unconventional monetary policy programs underscoring the Fed’s desire to maintain an accommodative monetary policy over the long term. The withdrawal of these programs, even if gradual, would therefore contribute to a normalization of long-term rates, which would then return to a level more in line with the US economic cycle and the scenario of a soft recovery in activity. Conversely, the Fed has demonstrated its willingness to keep short-term rates anchored at their floor for an extended period of time.
The communication efforts of the US monetary authorities since May 2013 have made it possible to clearly separate its objectives concerning the two ends of the yield curve. While at the beginning of summer 2013, following statements by Ben Bernanke, the markets had anticipated an earlier start to the rise in key rates (on July 5, 2013, the consensus was for rates to start rising in the first half of 2014), this date has now been pushed back to summer 2015, allowing the Fed to maintain a more accommodative monetary policy over the long term. This difference between tapering and tightening has significant effects.
First, it leads to a steepening of the US yield curve. While a rise in long-term rates could slow economic activity, particularly by weakening the recovery in markets that are heavily indexed to rates (such as the real estate market) or by disrupting capital flows to certain emerging economies (for more information, see the BSI Economics website), particularly the most fragile ones, it will nevertheless restore margins for certain financial players, such as banks and insurers, and mitigate the increasing risk-taking behavior (in order to ensure a sufficient return) observed in recent months. Indeed, the widening spread between short-term and long-term rates allows agents who earn income from maturity transformation to restore greater profitability. The rise in long-term rates also changes long-term financing and investment conditions and will lead to a rebalancing of agents’ portfolios [2]. Finally, volatility in certain market segments, particularly interest rates, may increase, which raises interest rate risk [3].
This development raises two issues that could prove significant. The first is whether the Fed has the means to control US short-term rates over the long term in order to keep them low for long enough, perhaps despite the recommendations of the rules for optimal setting of key interest rates. For the moment, there is no guarantee that this will not be the case, but the unprecedented nature of the situation and the sharp increase in the Fed’s balance sheet (more than $3.5 trillion in fall 2013 compared with $870 billion in July 2008) call for caution. The second risk is more immediate and concerns stock market prices, such as those of the S&P 500. This index has benefited particularly from QE3 (relatively more than other asset classes and indices) and has reached historic highs.
Without addressing here the question of whether or not there is a bubble in certain segments of the financial markets, a slowdown in QE could cause certain prices to collapse if they prove to be more fragile than expected, or more sensitive to the long end of the yield curve than to the short end [4]. This would then jeopardize a fragile economic recovery.
The evolution of the yield curve is therefore essential for the future of US monetary policy. The episodes of tension in the summer of 2013 helped to reinforce the distinction between tightening and tapering among market participants, while causing an upward adjustment in long-term rates. This difference now seems to have been well understood by the financial markets, allowing the Fed to separate the objectives assigned to each of its instruments. This freedom should facilitate the steps involved in ending the securities purchase programs and enable the monetary authorities to better control changes in the yield curve, particularly through their forward guidance (for further information, please refer to an article published on BSi Economics)which will certainly be forced to evolve and adapt. US monetary policy is therefore likely to remain accommodative in the medium term.
Nevertheless, it is important to remain vigilant with regard to changes in long-term rates, which could jeopardize the financing of the economy and create financial tensions at a time when questions are being raised about the short-term sustainability of current stock market valuations.
Chart 5
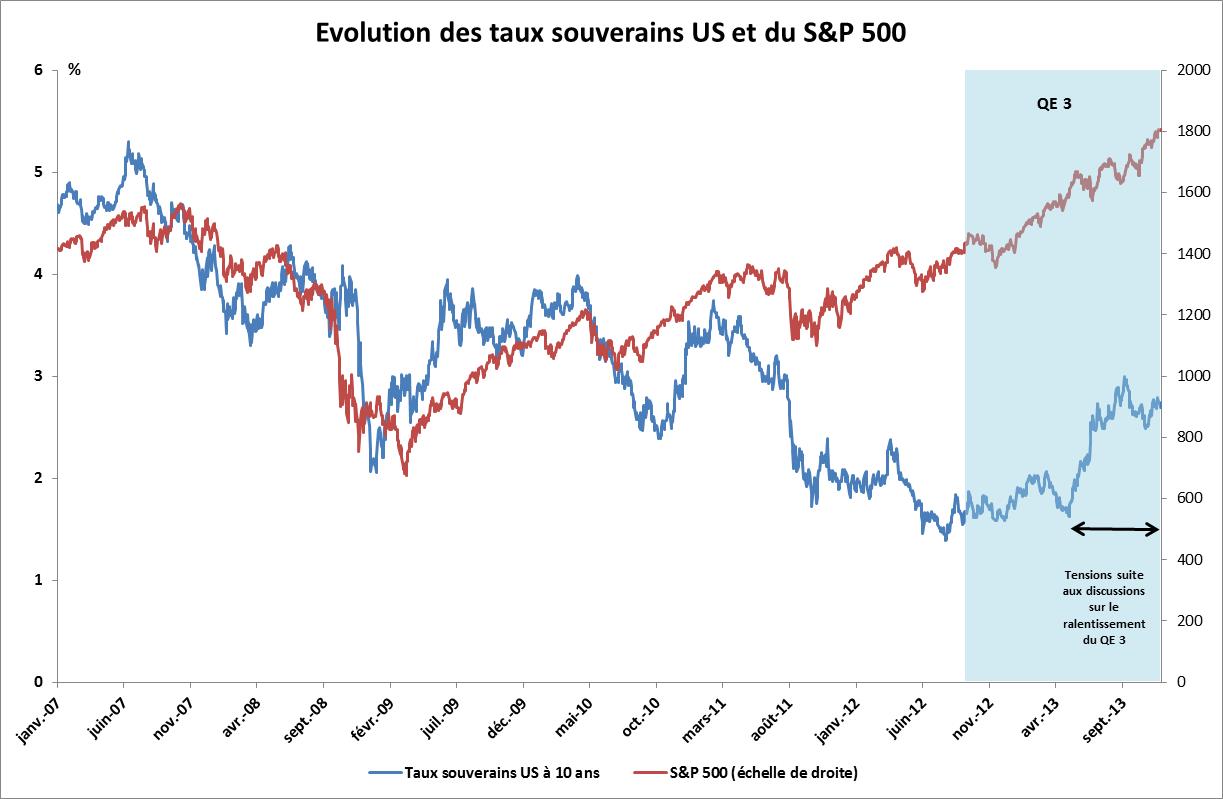
Source: BSI Economics, Bloomberg, Macrobond, last point: 12/01/2013
Conclusion
Based on market analysis, tapering now appears to be a clearly anticipated event in the short term. Furthermore, the distinction between this operation and the central bank’s key interest rate hike appears to have been made. Nevertheless, doubts remain about the Fed’s exact timetable, particularly the date on which the slowdown will begin and how it will be implemented. Thus, the episode of tension in the summer of 2013, which led to increased volatility in the markets and capital flows, may justify certain fears. In particular, if a herding phenomenon occurs, a sharp fall in certain indices would become possible, while weaknesses may have appeared in several market segments as a result of the low interest rate environment that has prevailed in recent years.
Notes
[1] GDP grew by 0.6% in the second quarter of 2013 and 0.7% in the third quarter, for an overall growth rate of 1.6% for 2013. November’s employment figures also exceeded analysts’ expectations by a wide margin.
[2] In particular, the respective weights of bonds and equities in these portfolios. These movements can be significant and destabilizing.
[3] The Fed’s forward guidance can thus be understood as a way of limiting this volatility while ensuring greater clarity in monetary policy, making it an effective tool for maintaining an accommodative monetary policy.
[4] See Chart 5. While QE3 appears to have reduced the correlation between the S&P 500 and the 10-year US Treasury yield by limiting the growth of the latter, uncertainties about the future of this program have restored a situation closer to the historical equilibrium.