Abstract:
– The state of secular stagnation is characterized by falling natural interest rates, which prevents the balance between savings and investment and depresses aggregate demand.
– The eurozone appears to be suffering from several symptoms of secular stagnation: a break in GDP from its historical trend, low investment, low inflation, and a liquidity trap.
– Beyond the symptoms, the eurozone appears to be experiencing significant historical trends: rising inequality, unfavorable demographics, and a deleveraging shock.

A little over a year ago, Larry Summers, former U.S. Treasury Secretary, gave a highly at the IMF. In his presentation, he argued that developed economies, particularly the United States, would suffer from what is known as « secular stagnation. » Summersmade two observations to support his argument. First, in the years leading up to the crisis, the huge financial bubble only allowed for economic growth close to its potential level and low inflation. Second, despite considerably reduced financial stress (at least in the United States) and a very accommodative monetary policy, there has been no strong economic recovery. These two observations lead Summers to believe that the period of growth (supported by financial bubbles) in the first half of the 2000s merely served to artificially mask the permanent stagnation of developed economies.
This concept of secular stagnation was developed during the interwar period in the United States by Hansen (1939). In its original meaning[1], structurally depressed demand produces a state of secular stagnation. In effect, the natural interest rate that would balance savings and investment would be negative. In this case, conventional monetary policy (via the short-term interest rate) would be unable to solve the problem, especially if inflation is low: this is known as the liquidity trap[2].
For a broader view of the debate, Warning Signals has published an articleon the subject. In this article, we will attempt to determine whether the eurozone is potentially in this state of economic stagnation. In particular, we will compare the current dynamics of the eurozone with those of Japan in the 1990s and the United States today. The reasoning is as follows: if the eurozone follows the Japanese dynamic (a country that has experienced very weak growth for more than 20 years) rather than the American one, then it is possible that the eurozone is in a state of secular stagnation.
The symptoms of secular stagnation
What are the symptoms of secular stagnation? First, GDP growth is very weak and diverges significantly from the historical trend. Second, this economic stagnation is likely to result in low investment. Third, short-term nominal interest rates would be close to 0. Fourth, inflation would be low (which would amplify the effects of the liquidity trap: real interest rates, although negative, would still be too high to support demand).
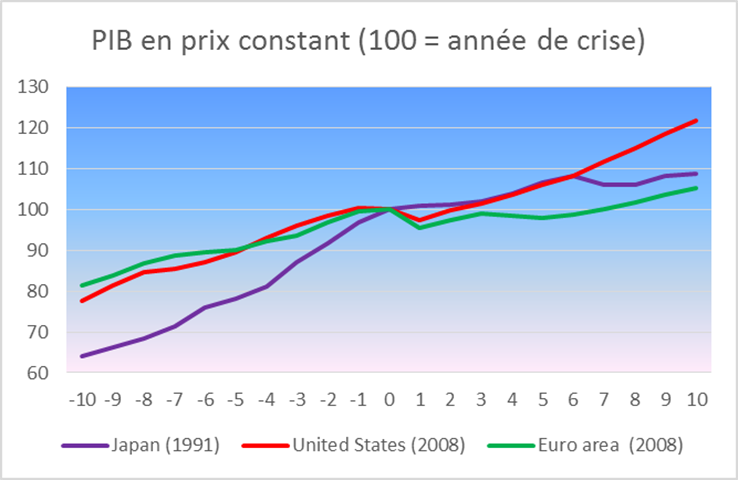
Sources: IMF, WEO October 2014, Macrobond, BSI Economics
Notes: The « 0 » on the x-axis represents the year in which a crisis began (2008 for the United States and the eurozone, 1991 for Japan). From year 6 after the crisis onwards, these are forecasts for the eurozone and the United States.
This graph clearly shows the double shock suffered by Europe: the Lehman bankruptcy and then the sovereign debt crisis. While the eurozone and the United States grew at similar rates in the 2000s prior to the crisis (and even up to the sovereign debt crisis), there was a very clear divergence after 2010. After five years of crisis, the eurozone’s GDP is still below its pre-crisis level. Furthermore, IMF forecasts indicate that the eurozone is likely to follow a similar trajectory to Japan, while the United States is expected to continue growing at a much more dynamic pace. However, these forecasts should be treated with caution, as they have often been revised downward in recent years (a phenomenon that is interpreted as a possible sign of secular stagnation).
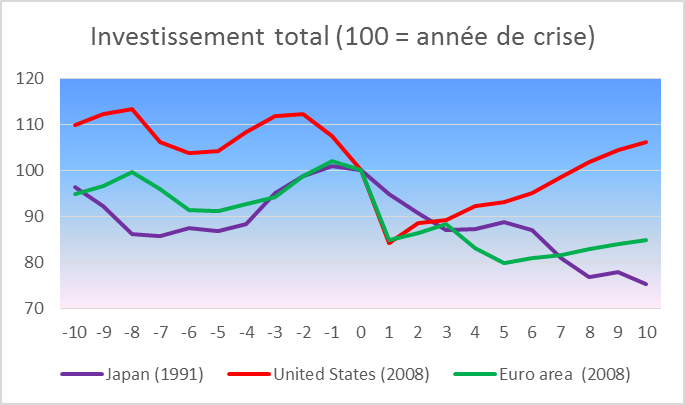
Sources: IMF, WEO October 2014, Macrobond, BSI Economics
The investment situation (-20% in 2013 compared with 2008) in the eurozone is critical. Once again, the double shock is present, but it was the sovereign debt crisis that caused the gap with the United States to widen. However, it is worth noting the scale of the shock following the bursting of the real estate bubble (2006) in the United States, which caused investment to fall by nearly 30% in just three years. At the same time, compared to Japan, the decline in investment (and GDP) in the eurozone is much greater (about 10 points difference five years after the shock (2013 for the eurozone)). While investment in the United States is expected to slowly return to pre-crisis levels of 21-22% of GDP, the eurozone is once again following a « Japanese dynamic » (according to IMF estimates).
In terms of short-term nominal interest rates, the Fed was the first to cut rates, and did so most rapidly, starting in 2007: within a year (from 2007 to 2008), the Fed’s key rate fell from 5.25% to 0.25%. The ECB was also fairly quick to act, although the scale of the refinancing rate cut was smaller than in the United States: from 4.25% in Q3 2008 to 1% less than a year later. The ECB did not reach US levels until the end of 2013, with even a slight increase in interest rates in the meantime. The ECB’s key rate currently stands at 0.05%. The Bank of Japan was the slowest to react, adopting a very gradual strategy: the key rate was still around 2% three years after the shock. However, if we compare the differences between the three trajectories, the ECB’s is closer to that of the Bank of Japan than to that of the Fed.
In terms of inflation, the eurozone is again moving closer to a Japanese-style scenario: inflation is currently at -0.2% (December 2014 estimate) compared with 0.8% a year earlier and 2.5% in October 2012. Some countries, such as Greece and Spain, are in deflation, which increases real interest rates.[3]and automatically tightens monetary policy. It should be noted, however, that for the time being, the impact on prices has been much less severe in Europe than in Japan.
These various empirical data suggest that the eurozone is likely to be in a state of permanent stagnation, as several elements of a Japanese-style scenario appear to be materializing. It is still too early to know whether these dynamics are here to stay or not. Nevertheless, analysis of the factors driving all the symptoms we have just described points to a long-term trend that is difficult to reverse.
The causes of secular stagnation
Secular stagnation is due to persistently negative natural interest rates resulting from a positive shock to savings and a negative shock to investment. Conventional monetary policy is therefore ineffective (liquidity trap) when nominal interest rates are zero and inflation is low. We must therefore examine whether there are reasons to believe that the dynamics described in the previous section are the result of a decrease in the natural interest rate.
A low (or even negative) rate of growth in the working population is one potential reason. According to Hansen (1939), a growing working population implies strong investment demand, particularly to meet the demand for new housing. Conversely, a stagnant labor force due to an aging population (at a constant retirement age) increases demand for services and consumer goods (personal assistance, food expenses, etc.), which generally require little capital and investment. This has implications for investment demand, which shifts and increases/decreases the natural interest rate.
Secondly, increasing inequality could potentially increase the supply of savings. This point is quite controversial and various macroeconomic studies have not found a clear relationship. It should be noted that wealthier households have a higher marginal propensity to save than lower-income households. Growing inequality would imply a growing share of total income held by the wealthiest households and therefore, in theory, an increase in the supply of savings in the economy. However, this relationship is not so simple. For example, in the United States before the crisis, even as inequality was rapidly widening, the less affluent classes, in order to keep pace with the rising standard of living of the affluent classes, reduced their savings rate while taking on debt, which resulted in an overall decline in savings in the economy. On this point, therefore, the effect of inequality on savings depends on the situation in each country and, in particular, on households’ access to financial markets and bank credit.
A significant deleveraging shock would be the third possible factor (Eggertsson and Mehrotra, 2014): « If a borrower reduces their debt stock today (due to a deleveraging shock), their savings capacity will be higher when the adjustment is complete, as they will have less debt to repay. » As a result, the supply of savings would increase after the shock, which would reduce the natural interest rate.
Let us now turn to the empirical evidence. The dependency ratio[4](mainly the old-age component) is increasing in Europe. This implies a decline in the working population and therefore potentially a decline in investment demand. This dynamic, which is not unique to Europe, has been in place since the 1990s. The situation between now and 2050 is not as critical as that in Japan, but by that time there will nevertheless be only two workers for every retiree in Europe (with the retirement age set at 65).
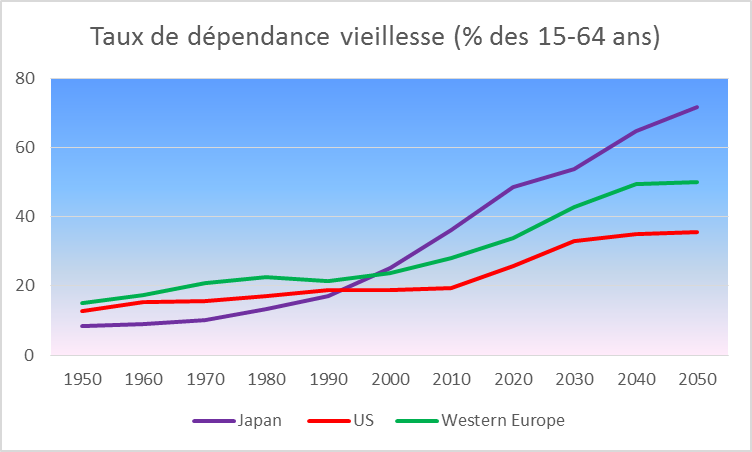
Sources: United Nations, BSI Economics
Inequality has been increasing significantly in Europe since the 1980s. The same phenomenon has also occurred in Japan. However, these increases are nothing compared to what is happening in the United States, where the wealthiest 10% of households now account for nearly 50% of national income. Even if, in relative terms, Europe is doing rather well (although national dynamics should not be underestimated; see Portugal, Ireland, and Italy, for example), the problem exists in absolute terms. Once again, this may have increased the supply of savings and thus lowered the natural interest rate in the eurozone.
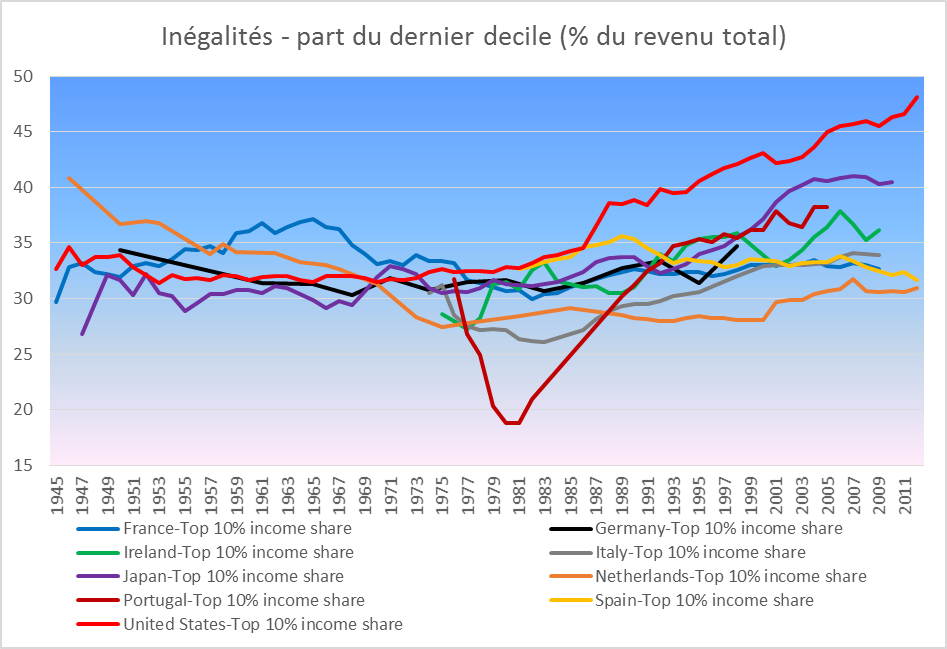
Sources: World Top Incomes Database, BSI Economics
The deleveraging shock is very much present in both the private sector (households and non-financial corporations) and the public sector in the eurozone. Private debt in the eurozone rose to 170% of GDP in 2009, with very different situations within the monetary union. After the sudden halt in the financing of peripheral countries’ debt by capital from the core (see Merler and Pisani-Ferry, 2012), households and non-financial corporations were forced to begin deleveraging. This process is extremely slow in the eurozone, whereas it appears to be complete in the United States, where private debt is close to 2004 levels (see Artus, 2014). Artus (2014) explains that this very slow deleveraging is due to an unfavorable interest rate-growth rate differential and insufficient austerity measures (increased savings and decreased investment). Given that this process is particularly slow, corporate investment and household consumption are being negatively impacted in the long term. The public sectors have also undergone a deleveraging shock (forced for some) following the 2009 fiscal stimulus and the bailout of national financial sectors, which severely damaged public finances (see Ireland and Spain in particular). The effect on total savings in the economy is not yet clear, as the adjustment to the shock is not yet complete in the eurozone.
Conclusion
The concept of secular stagnation is very useful for understanding the problems currently facing the eurozone, particularly when compared to the United States and Japan. Indeed, the eurozone appears to be showing the symptoms of secular stagnation and is moving closer to a Japanese-style scenario: weak growth, low investment, liquidity trap, and low inflation. This would translate into a negative natural interest rate caused by several factors: unfavorable demographics, rising inequality, and a sustained deleveraging shock.
Notes:
[1] In its alternative meaning developed by Gordon (2014), secular stagnation occurs for reasons related to the supply side of the economy: the pace of innovation and productivity gains are low. Here, it is not the gap to potential growth that is at issue, but potential growth itself. We will not elaborate further on this second meaning in this article.
[2] A liquidity trap is a situation in which the injection of money by a central bank no longer lowers interest rates.
[3] The real interest rate is the nominal interest rate adjusted for price changes, so in a deflationary environment, despite a low nominal rate, the real rate increases.
[4] The old-age component of the dependency ratio is the ratio between the population aged 65 and over and the population aged 15 to 64 (of working age).
References:
– Eggertsson, G., & Mehrotra, N. A Model of Secular Stagnation.
– Hansen, A. H. (1939). Economic progress and declining population growth. The American Economic Review, 1-15.
– Merler, S., & Pisani-Ferry, J. (2012). Sudden stops in the euro area(No. 2012/06). Bruegel Policy Contribution.