The conflict in Ukraine has led to a sharp rise in food prices, particularly wheat prices, which rose by 32% between April 2022 and the beginning of the year. This price increase is the result of several factors: uncertainty surrounding the duration of the conflict in Ukraine, sanctions against Russia, and rising costs of essential production inputs (fertilizers, fuel). Russia and Ukraine play a significant role in the wheat market, accounting for nearly 15% of global wheat production.
The Food and Agriculture Organization of the United Nations (FAO) fears that this situation on the wheat market could lead to famine, particularly in West Africa. However, the level of vulnerability differs from one country to another. This note identifies these countries using international comparisons based on several criteria: wheat imports from Russia and Ukraine, wheat consumption, the ratio of dependence on wheat imports, and wheat stocks at the end of 2021.
Dependence on Russia and Ukraine and supply risk
High dependence on Ukraine and Russia is a source of high supply risk and therefore potential wheat shortages. The conflict in Ukraine is currently blocking wheat trade from Ukrainian ports on the Black Sea. The longer the conflict lasts, the greater the risk that the country’s production capacity will be damaged (whether in terms of sowing, harvesting, infrastructure, or logistics). Furthermore, the exclusion of Russian banks from the SWIFT global interbank network is making banking and commercial transactions with Russia more difficult and is therefore hampering the country’s ability to export, particularly wheat, of which it is the world’s leading exporter.
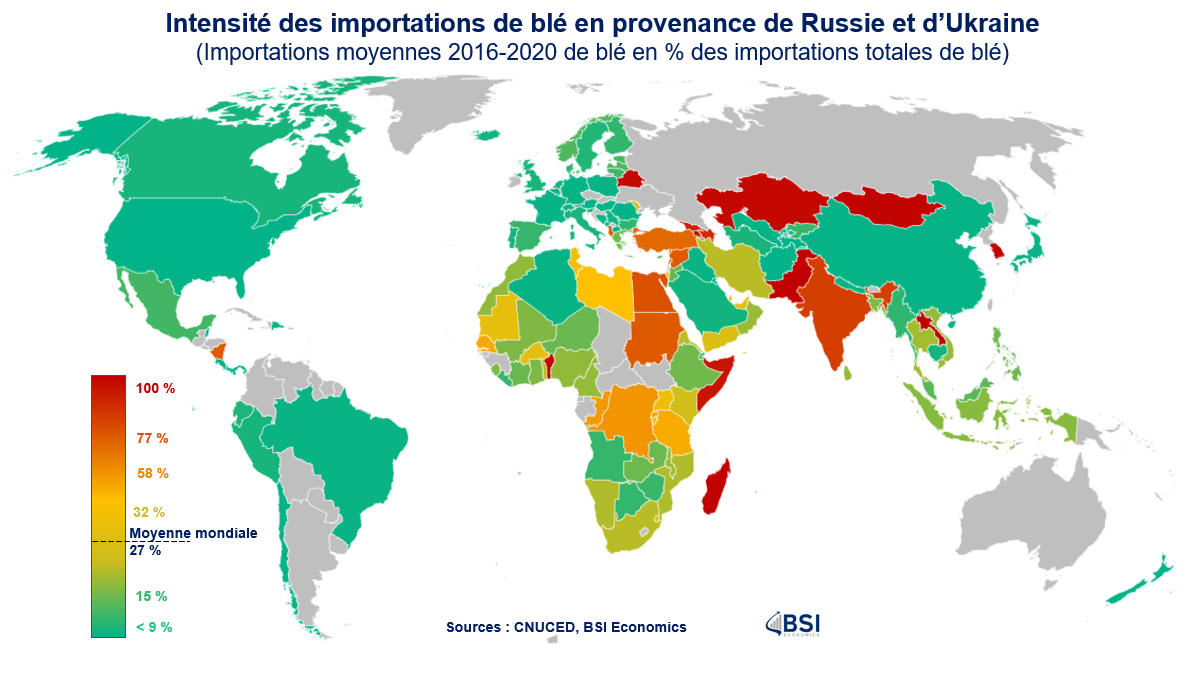
The map above shows the share of wheat imports from Russia and Ukraine in each country’s total wheat imports. The average share of these two countries in total wheat imports was 27% between 2016 and 2020. While Europe and Latin America appear to be relatively independent of these countries (excluding Turkey), the level of dependence varies more in sub-Saharan Africa (high exposure for Benin, Madagascar, Senegal, and Sudan), the Middle East and Central Asia (very significant exposure in Azerbaijan, Armenia, Egypt, and Lebanon), and Asia (India, Mongolia, and Laos).
Wheat consumption and risk to public finances
Relying solely on dependence on Russian and Ukrainian imports can be misleading. Indeed, if countries have a relatively low propensity to consume wheat[2], the risks associated with high dependence on these countries appear to be more limited. On the contrary, in countries with high wheat consumption, measures could be put in place or reinforced to limit the impact of rising wheat prices on individuals’ purchasing power[3]. These public policies generally take the form of higher subsidies for foodstuffs and may ultimately lead to a deterioration in the public balance and cause tensions over the financing of public deficits[4].
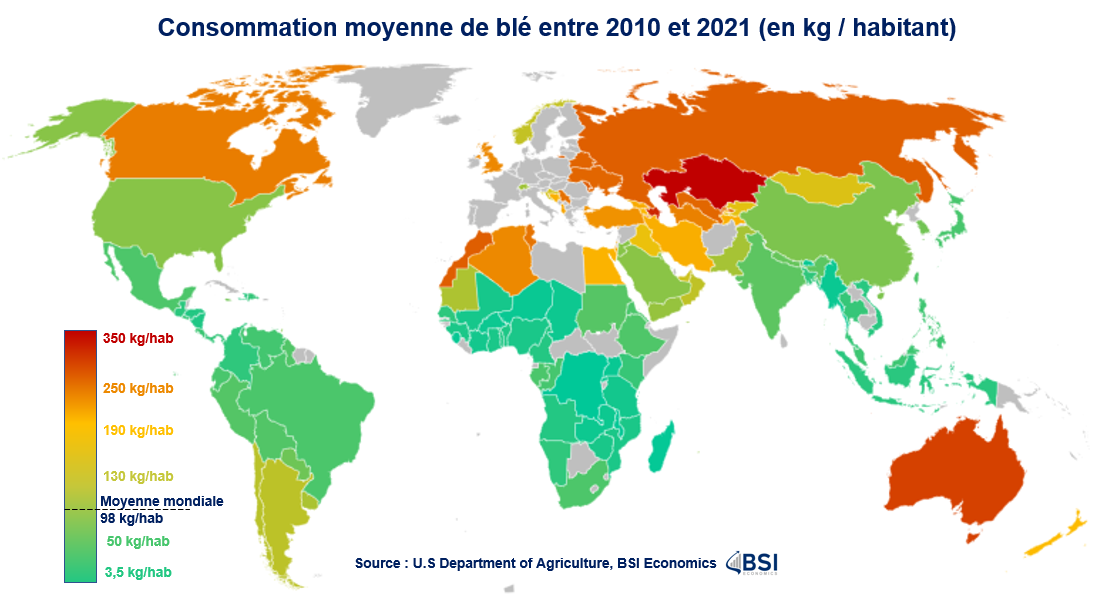
The graph above puts the level of risk into perspective, particularly in sub-Saharan Africa and Asia, where per capita wheat consumption (kg/capita) is sometimes well below the global average annual wheat consumption (98 kg/capita). Nevertheless, there is increased fragility, especially in North Africa, the Middle East, and Central Asia, with annual wheat consumption exceeding 200 kg/capita in Kazakhstan (350 kg/capita), Azerbaijan (314 kg/capita), Morocco (265 kg/capita), Uzbekistan ( 257 kg/capita), Tunisia (245 kg/capita), and Turkey ( 218 kg/capita).
Dependence on net wheat imports and inflationary risks
By cross-referencing information on wheat consumption and net wheat imports[5], it is possible to calculate a dependency ratio and obtain the share of net wheat imports needed to meet domestic market demand. Comparing dependency ratios allows us to see which countries would be most exposed to inflationary risk linked to the spread of rising wheat prices. Given that foodstuffs have a significant weight in the calculation of inflation, especially in emerging and developing countries[6], this ratio can serve as an early warning indicator for identifying future inflationary pressures[7]. Countries where food items carry significant weight in inflation calculations will likely face a trade-off between raising interest rates to counter inflationary pressures and maintaining the status quo to support economic recovery. This choice may prove difficult for countries that are still struggling to return to their pre-pandemic levels of activity (South Africa, Angola, Mexico, Thailand, and Tunisia, for example).
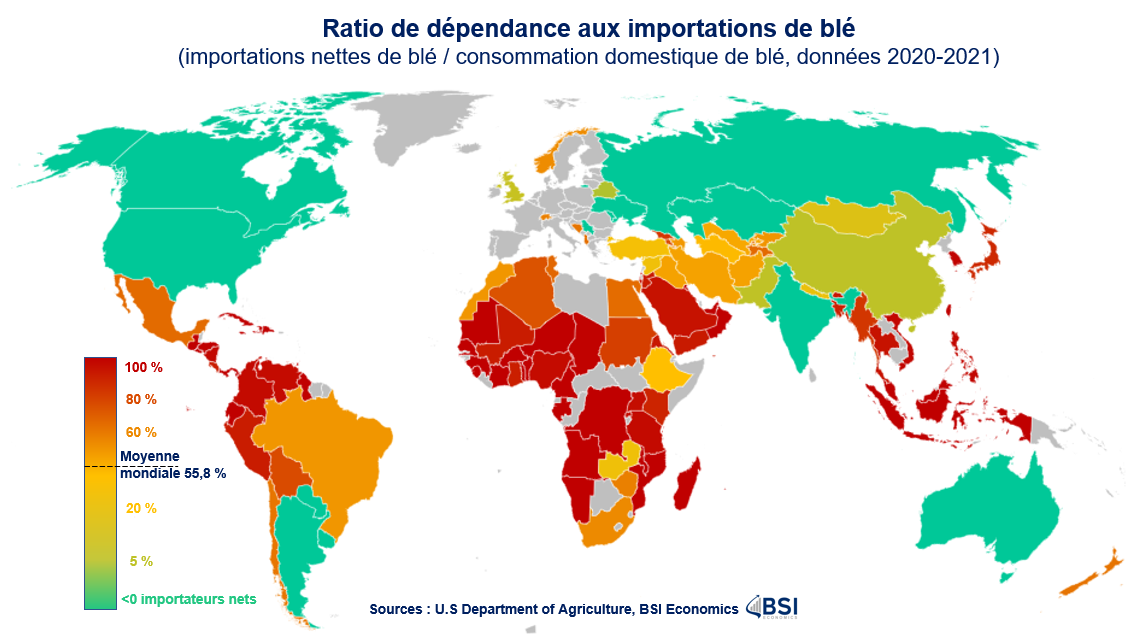
The chart above shows that countriesin Africa, the Middle East, and Central Asia appear to be the most vulnerable, with a dependency ratio above the global average (56%). This is also the case in Latin America and Southeast Asia, two regions that seemed to have been « spared » based on the other criteria mentioned above. The countries shown in green on the map (Argentina, Australia, Canada, the United States, Kazakhstan, Paraguay, and Uruguay) have a negative ratio, meaning that local production exceeds domestic needs and thus offers opportunities for export. They could therefore benefit from the rise in wheat prices and also offer alternatives to reduce supply risks between now and 2023.
Stocks and challenges for 2022 and 2023
All of the vulnerabilities identified so far may be reconsidered, given the level of wheat stocks at the end of 2021. High stock levels would provide strategic reserves that could be drawn on to compensate for lower harvests in 2022 or, more importantly, to cope in the short term with the reorganization of supply chains for 2022 and 2023.
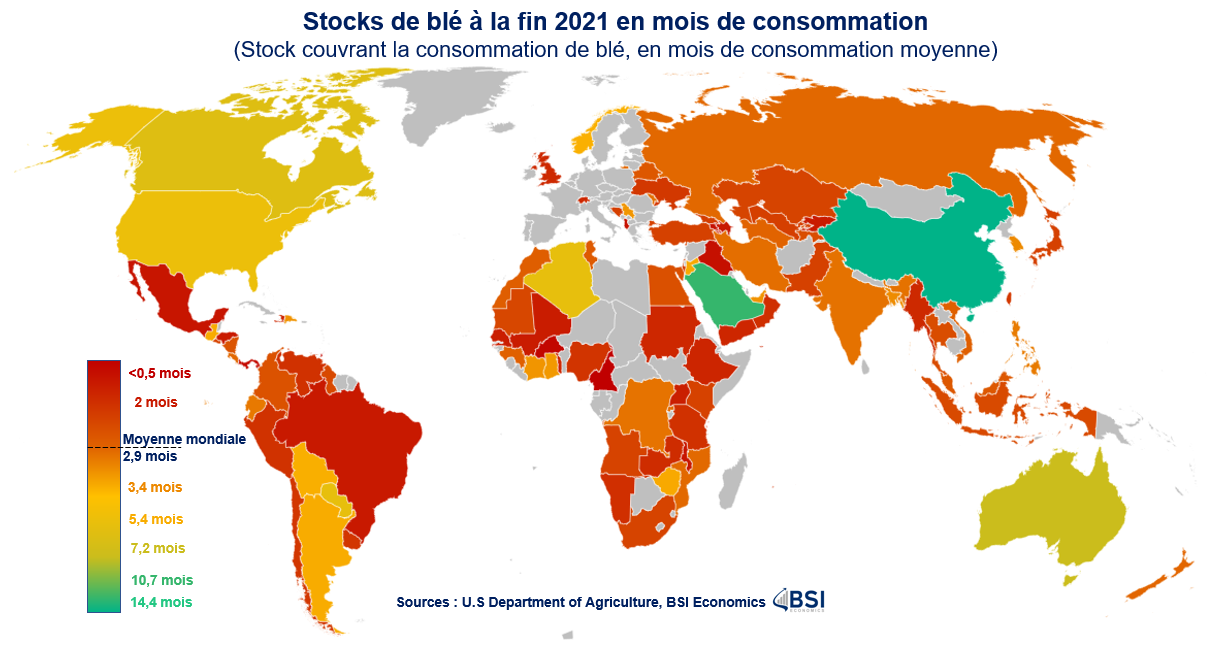
The chart above provides an overview of stock levels in months of consumption at the end of 2021. Globally, the average level of wheat stocks was only 2.9 months of consumption. With 14.4 months, China would be the only country with stock levels exceeding one year of consumption. Four major producers appear to have margins in terms of stocks (Argentina, Australia, the United States, and Canada: nearly 6 months of consumption). Among the countries previously identified as fragile, several appear particularly vulnerable given their low stocks: in North Africa (Egypt, Morocco, Tunisia), the Middle East and Central Asia (Armenia, Iraq, Uzbekistan) and, more generally, in Sub-Saharan Africa.
Conclusion
In 2022, the reorganization of supply chains in the wheat market will be crucial to avoiding shortages and reversing the current price trend. According to the FAO, global wheat production is expected to increase in 2022, mainly driven by higher production in North America. Countries such asFrance, Argentina, Australia, India, and Kazakhstan are expected to benefit and thus partially offset the decline in Russian and Ukrainian supply. They would partly respond to the supply challenges of regions in difficulty and help rebuild stocks to prevent the current crisis from extending into 2023.
Beyond these figures and production levels in 2022, other parameters will be decisive in assessing the evolution of food risks on the wheat market (and also other commodities: corn, soybeans, sunflowers, rapeseed): first and foremost, the duration and intensity of the war in Ukraine, fertilizer prices, weather conditions (rainfall rates), and water stocks.
[1]The price of wheat rose from USD 7.9 per bushelon January1, 2022, to an average of nearly USD 10 in the first week of April, with a historic peak of USD 11.4 on March 7, 2022. As a reminder, the bushel is the unit of measurement used for wheat pricing, with one bushel representing 27.1 kilograms.
[2]In some countries, wheat accounts for a low level of annual per capita consumption due to dietary preferences or the historical availability of other crops (such as corn or rice, for example).
[3]As is currently the case in Egypt and Indonesia, for example.
[4]Inflationary pressures generally lead to interest rate hikes (e.g., in South America since H2 2021), which have an impact on domestic financing costs, and the international context is also proving less favorable, in line with monetary tightening in the United States.
[5]Net wheat imports = wheat imports – wheat exports. Negative net imports correspond to a situation where a country has positive export capacity.
[6]35% on average, 25% for Brazil, Côte d’Ivoire and Turkey, and up to more than 50% in Angola, Bangladesh and Nigeria, for example.
[7]A trend that is likely to accelerate in early 2022, excluding energy prices, given monthly price developments in Argentina, Ethiopia, Kenya, Rwanda, and Turkey, for example.