The Citi Economic Surprise Index (CESI) indicates the extent to which published macroeconomic data outperforms forecasters’ expectations (consensus). For example, if an indicator of industrial activity is published above expectations, this contributes to a positive Citi surprise indicator. Expressed as a percentage deviation from historical volatility, the indicator is calculated over three months based on the macroeconomic indicators available for that period.
However, the correlation between this indicator’s results and the markets remains weak. The indicator does have a strong and significant link with stock indices, particularly in bullish phases. Nevertheless, historically, six of the last seven times the CESI turned negative led to a contraction in stock indices (Russell 3000) over the following three months.
On the other hand, it is weakly correlated with the performance of sovereign or corporate bonds: beating expectations leads to taking more risk (hence an increase in credit risk—positive correlation) but also to reallocating portfolios towards riskier assets, hence a negative correlation with bond prices.
Finally, the importance of central bankers’ decisions in the evolution of financial markets can render the link between good macroeconomic indicators and market performance negligible, while commodity prices seem to be more influenced by Chinese demand than by US or Asian economic indicators.
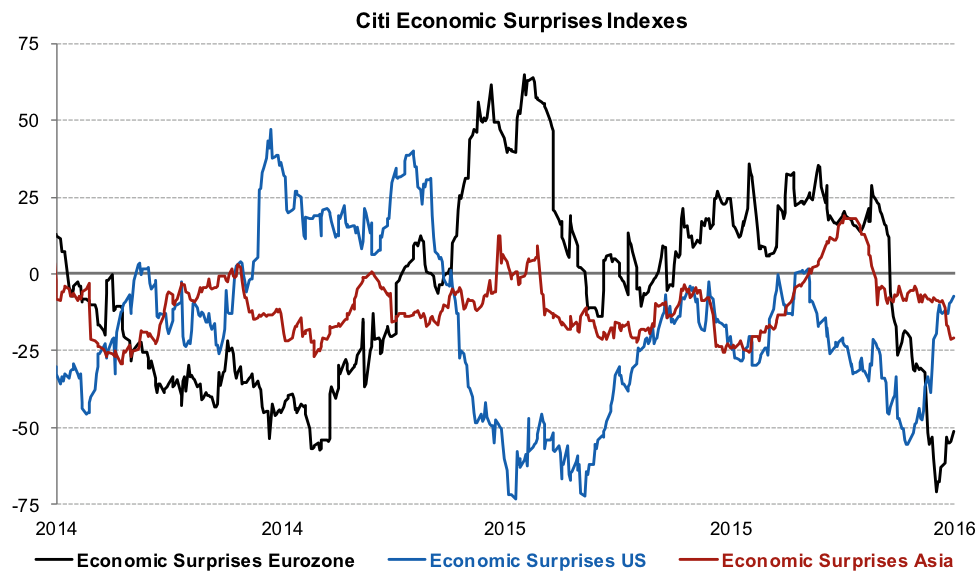
In March 2016, economic surprise indicators stood at -9 in the US, -56 in the eurozone, and -21 in Asia.