Summary:
– Italy’s GDP in 2014 was lower than its 2000 level. Since 2011, Italy has experienced thirteen quarters of recession, and its GDP in volume terms in 2014 was 9% lower than its 2007 peak.
– Since 2000, Italy’s GDP per capita has fallen behind that of the leading OECD economies. Slightly higher than the OECD average in 2000, Italy’s GDP per capita was below average in 2013.
– Italy’s low GDP per capita is the result of a decline in the working-age population, a particularly low employment rate, and low productivity gains.
– In order to raise its GDP per capita, Italy must first and foremost reduce its employment rate deficit through an active policy of increasing labor force participation, particularly among women. Other reforms must focus on increasing productivity gains and reducing the structural unemployment rate.
– Italy has already begun to take « the right turn »: the OECD estimates that the reforms currently being implemented in Italy, if fully implemented, would result in an additional 6% GDP growth in ten years.

In the science fiction film Back to the Future, Marty McFly, an American teenager living in 1985, travels back in time. Thanks to a time machine, designed in the form of the legendary DeLorean DMC-12, Marty is propelled 30 years back in time to 1955. For Italians, however, this idea of going back in time is not fiction: not only has Italy’s GDP in 2014 fallen below its 2000 level, but its GDP per capita is now lower than it was in 1997.
Italy’s current GDP is lower than it was in 2000
« The world cannot afford a lost decade in Europe. » With these words, spoken on November 12, 2014, US Treasury Secretary Jacob Lew urged European leaders to take « decisive action » to halt the decline in economic activity. However, in Italy, more than a decade has already been lost, as evidenced by particularly worrying statistics. Since 2011, Italy has experienced thirteen out of sixteen quarters of recession, and its GDP in volume terms in 2014 was 9% lower than its peak in 2007. Over the period, Italian GDP growth was also the lowest in the eurozone, with the exception of Greece. The combination of these factors means that Italy’s GDP in volume terms is now lower than its 2000 level. Thus, it is not 10, but already 14 years that have been lost in Italy (Figure 1).
Chart 1: Change in Italy’s GDP in volume terms, base 100 = 2000
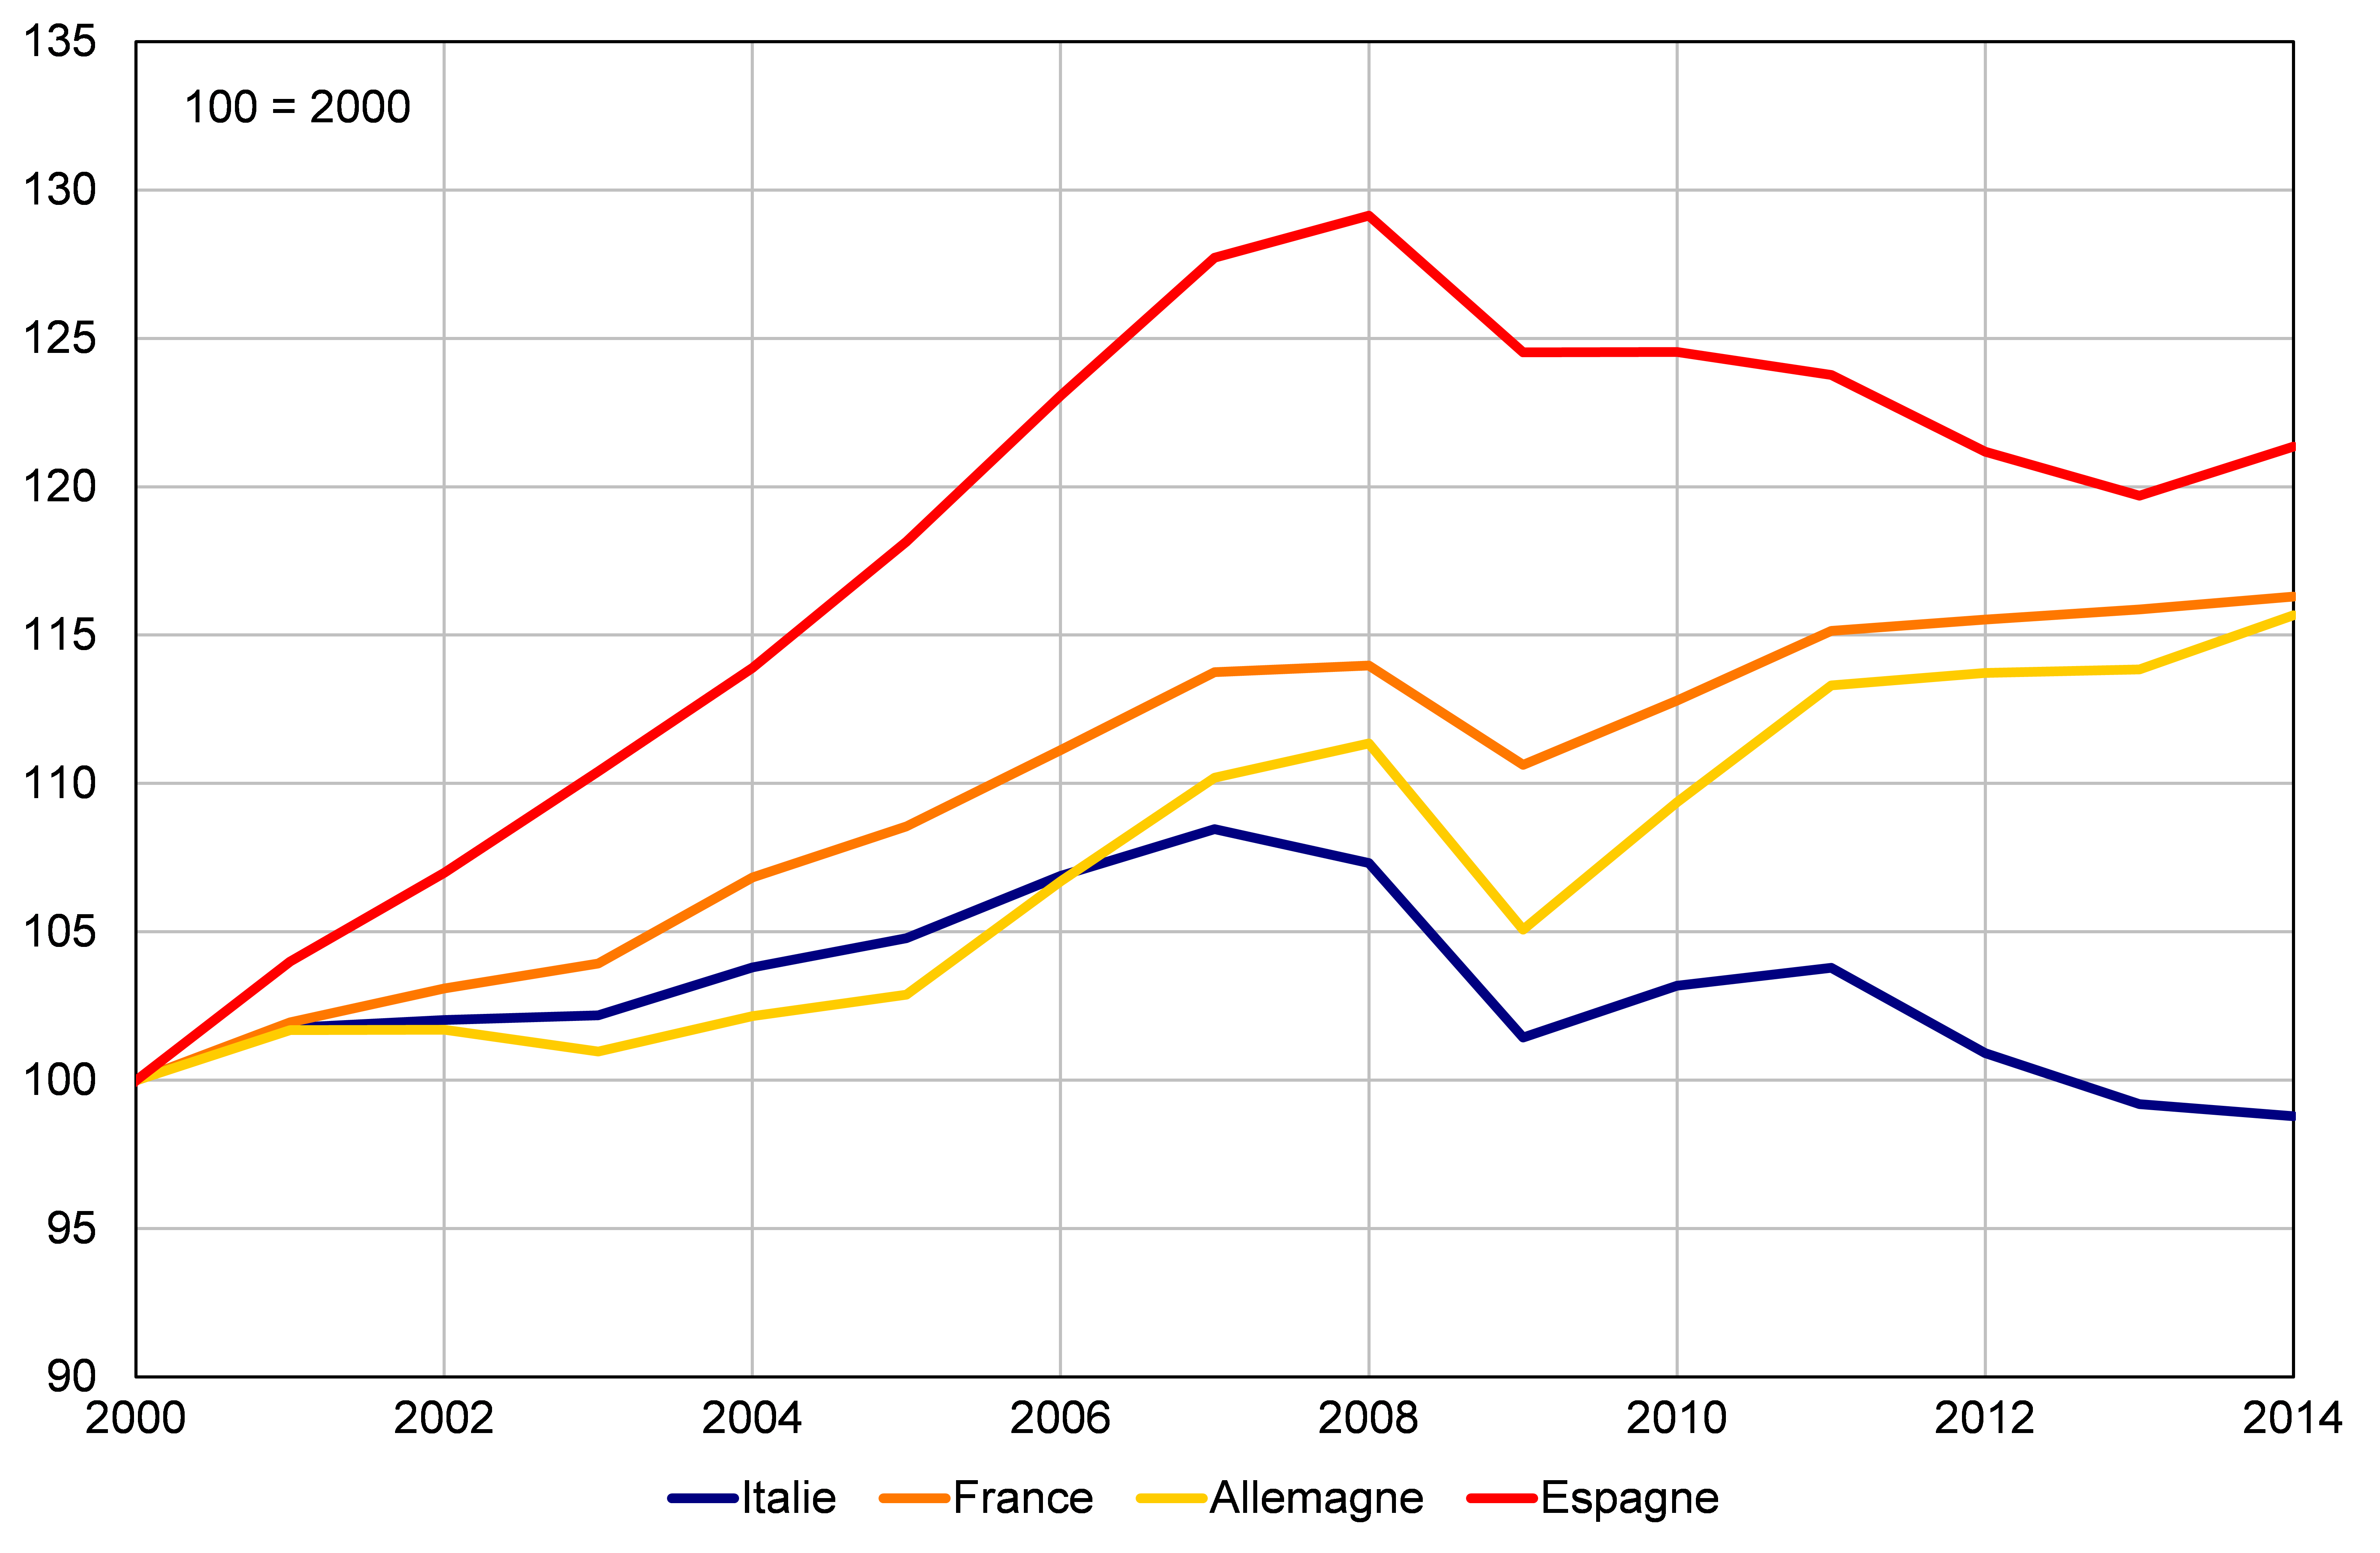
Sources: Istat, Macrobond, BSI Economics
Since 2000, Italy’s GDP per capita has fallen since the crisis
Italy’s GDP per capita grew between 2000 and 2007, albeit at a slower pace than in Spain, Germany, or France[1](Figure 2). It was in 2006 that Italy’s GDP per capita began to lag behind that of its main partners. The economic crisis that began in 2008 only exacerbated this gap with France and Germany, while Spain saw a marked correction. While Italy’s GDP per capita was significantly higher than Spain’s in 2000, it was only slightly higher in 2013. Between 2000 and 2013, Italy’s GDP per capita, calculated at constant prices and purchasing power[2], fell from $28,822 to $26,920. Slightly higher than the OECD average GDP per capita in 2000 ($28,210), Italy’s GDP per capita was below that average in 2013[3($31,944).
Figure 2: Change in GDP per capita since 2000, base 100 = 2000
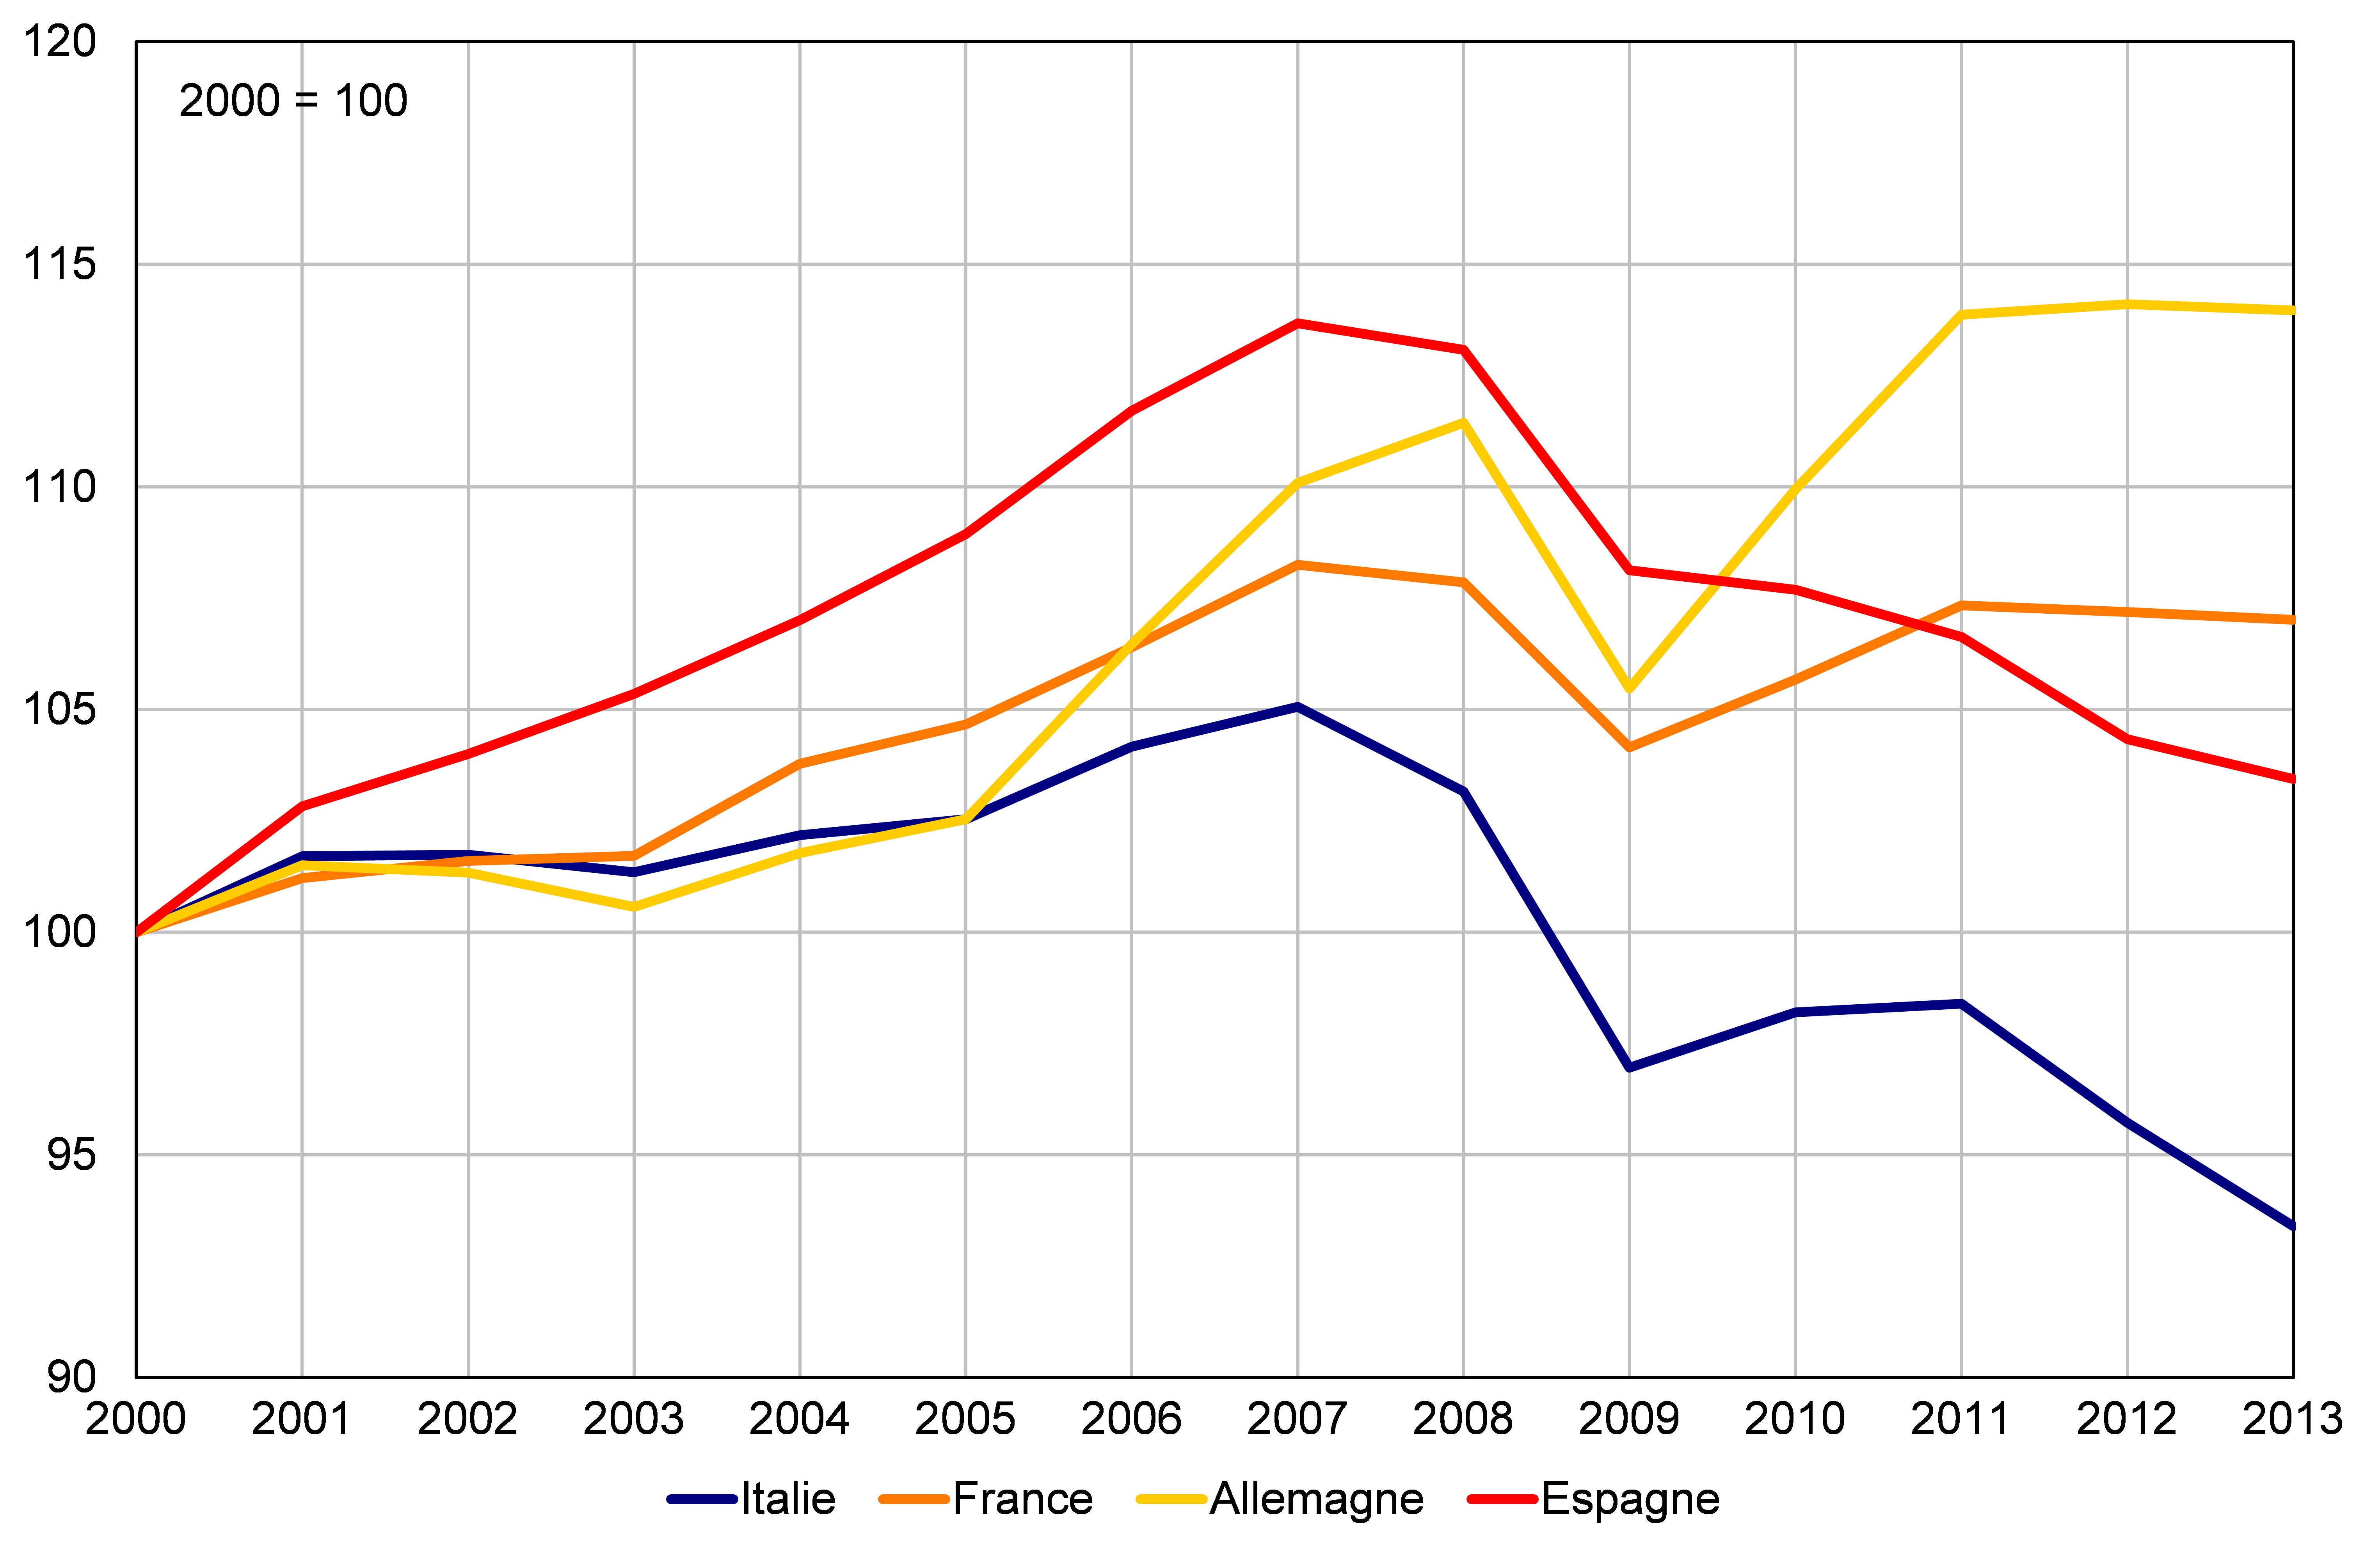
Sources: Istat, Macrobond, BSI Economics
Low GDP per capita in Italy: A decline in the working-age population, a particularly low employment rate, and low productivity gains
While GDP corresponds to the value of all goods and services produced in a given country over a given period, GDP per capita[4]reflects the standard of living of the population. It is therefore by studying changes in the working-age population, the employment rate, and labor productivity that we can understand the factors behind Italy’s low GDP per capita.
Changes in the working-age population[5]is unfavorable in all four of the eurozone’s major economies. It therefore cannot explain Italy’s decline in GDP per capita relative to its partners, even though it is playing a downward role (Figure 3).
Figure 3: Share of the working-age population in Italy
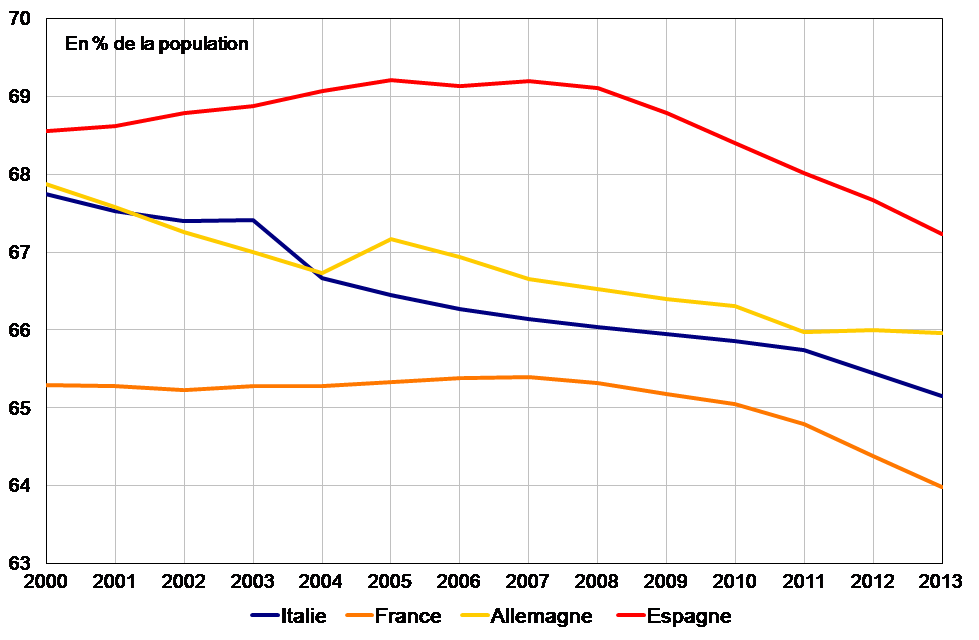
Sources: Eurostat, Macrobond, BSI Economics
The employment rate[6]corresponds to the number of individuals in employment within the working-age population. Although it rose slightly between 2000 and 2013 in Italy, thanks to an increase in the labor force participation rate, it remains well below that of France or Germany. The gap with France and Germany widened from 2008 onwards, due to the higher increase in unemployment in Italy than in France and Spain. The case of Spain is somewhat unusual: the sharp decline in the employment rate since 2007 is a direct consequence of the surge in unemployment, which rose from less than 8.2% in 2007 to 24.4% in 2014. The low employment rate is therefore a major factor in understanding Italy’s low GDP per capita (graphs 4).
Chart 4: Employment rate of the working-age population (15-64 years old)

Sources: Eurostat, Macrobond, BSI Economics
In 2013, the number of hours worked per capita per year in Italy was 701, the same as in Germany, but higher than in Spain (654 hours) and France (622 hours). A comparison of GDP per capita calculated in this way shows that, in terms of hours worked, Italy’s GDP per capita is lower than that of Germany (the same as GDP per capita), much lower than that of France (much more than the difference not adjusted for hours worked), and even lower than that of Spain. The number of hours worked therefore does not explain the decline in GDP per capita in Italy.
Over the period 1995-2011, the annual growth rate of labor productivity in Italy was lower than that of Spain, France, and Germany, mainly due to a decline in multifactor productivity. Weak productivity gains thus contribute significantly to the gap in GDP per capita between Italy and France, Germany, and Spain (Figure 5).
Figure 5: Labor productivity growth and its components (1995-2011)

Sources: OECD, Macrobond, BSI Economics
Two levers for raising GDP per capita in Italy
In order to raise its GDP per capita, Italy must first and foremost reduce its employment rate deficit through an active policy of increasing the labor force participation rate and reducing the structural unemployment rate. In particular, measures to raise the employment rate must give priority to women: the employment rate for women was only 46.5% in Italy in 2013 (64.8% for men), compared with 60.4% in France (67.8% for men) and 69.0% in Germany (78.0% for men).
Italy must also continue with reforms aimed at supporting hourly productivity, which may involve policies to promote innovation and strengthen competition.
Italy has already begun to take « the right turn. »[7] , » with the announcement of numerous reforms since Matteo Renzi came to power. In its latest study[8]on Italy, the OECD estimates that reforms in Italy, if fully implemented, would result in an additional 6.0% GDP growth in ten years (Figure 6).
Figure 6: Labor productivity growth and its components (1995-2011)

Sources: OECD, Macrobond, BSI Economics
In its study, the OECD emphasizes the importance of the Jobs Act, the new employment law of December 2014, which aims to streamline employment protection, develop active labor market policies, and increase the effectiveness of social protection and the labor force participation rate of women, while reducing labor costs. The study also recommends strengthening competition in local public services and continuing to remove barriers to entry in regulated professions and retail trade. However, the OECD points out in its study that, in order to achieve this additional growth of 6.0% over 10 years, full and effective implementation of these reforms is necessary.
Italy and Italians have already lost 10 years, marked by a decline in the country’s total wealth and per capita wealth. The question now is not whether Italians can avoid losing another decade, but rather how they can avoid another lost decade, synonymous with a decline in their per capita wealth. With growth gains[9]of -0.1% in the fourth quarter of 2014 for 2015, reform is the only way for Italy to return to growth and look to the future. Not to 1990 or 2000, but to 2025.
Notes:
[1] In the case of France, Antonin Bergeaud, Gilbert Cette, and Rémy Lecat explain that since the mid-1990s, the stability of the French situation relative to the eurozone as a whole has been the result of a relative decline in Italy’s GDP per capita, which has offset a relative increase in Germany’s. See Antonin Bergeaud, Gilbert Cette, and Rémy Lecat. Long-term per capita gross domestic product in France and other advanced countries: the role of productivity and employment, Economie et Statistique, February 2015 – No. 474.
[2] The use of constant relative prices makes it possible to measure relative changes in GDP per capita over time and calculate growth rates.
[3] This observation also applies to France, which has seen its GDP per capita grow more slowly than the OECD average.
[4] Per capita GDP is calculated as follows: Per capita GDP = Working-age population × Employment rate × Labor productivity per worker.
[5] The share of the working-age population is calculated as the ratio of the population aged 15 to 64 to the total population.
[6] The employment rate is calculated as follows: (1 – unemployment rate) * labor force participation rate
[7] With reference to the « La svolta buona » program presented by Matteo Renzi in March 2014.
[8] OECD Economic Surveys: Italy 2015, February 2015
[9] The GDP growth rate for 2015 corresponds to the growth rate of the variable between 2014 and 2015 that would be obtained if GDP remained at the level of the last known quarter (Q4 2014) until the end of 2015.