The Gini coefficient, or Gini index, is a statistical measure used to account for the distribution of a variable (salary, income, wealth, etc.) within a population. In other words, it measures the level of inequality in the distribution of a variable within the population.
The coefficient ranges from 0 (perfect equality) to 1 (perfect inequality). However, it is not uncommon to see the Gini coefficient fluctuate between 0 and 100 when it comes from an international institution (e.g., the World Bank). In this case, the Gini coefficient, initially between 0 and 1, has simply been multiplied by 100 to make it easier to read.
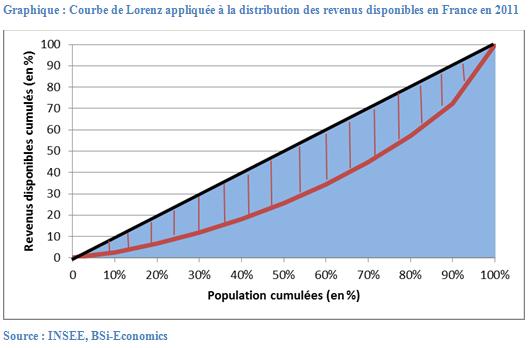
The Gini coefficient is calculated using the Lorenz curve (see graph below). To obtain it, divide the area of the red shaded area, i.e., the space between the bisector (representing perfect equality) and the Lorenz curve (observed distribution of disposable income), by the area of the blue rectangle. This gives a ratio which is the Gini coefficient. For France in 2011, the Gini coefficient applied to disposable income was 0.352.
The Gini coefficient is a widely used measure of economic inequality. This indicator has the advantage of being easy to understand and does not require any predefined assumptions. However, it has certain limitations that must be kept in mind.
First, it does not provide any indication of income levels. Thus, it is possible for two countries to have identical Gini coefficients even though their levels of wealth are different.
Second, the same Gini coefficient can correspond to different income distributions. For example, if the poorest 50% of the population has no income and the wealthiest 50% shares the remaining income equally, then the Gini coefficient is 0.5. It also reaches 0.5 when the poorest 75% share 25% of the income and the wealthiest 25% have 75% of the income.
Finally, the Gini coefficient does not reveal anything about what causes inequalities to change. Indeed, if the coefficient increases, it is not possible to know whether this is due to the bottom or the top of the income distribution.
David Marguerit