- The Carbon Border Adjustment Mechanism (CBAM) was launched in October 2023 in the European Union (EU) and will come into full effect in 2026. While the CBAM will undoubtedly go a long way toward addressing the problem of « carbon leakage, » several studies show that it does little to solve the problem of lost export competitiveness and could even generate undesirable externalities.
- This first note seeks to identify the EU countries most exposed to imports of products subject to the MACF and which would be the potential losers. It appears that Eastern European countries seem to be the most exposed.
- The steel and aluminum subcategories account for 83% of products subject to the MACF on average, and countries such as Belgium, the Netherlands, and Sweden appear to be particularly exposed to these imported products.
- For other products, exposure levels vary greatly from country to country: nitrogen fertilizers (France, Spain, Bulgaria), cement (Spain, Croatia), electricity (Slovakia, Estonia, Croatia), and hydrogen (Germany).
- The carbon intensity of non-EU imports of metallurgical products (including steel and aluminum) tends to increase the cost associated with the MACF in several countries (Estonia and Italy being the most affected).
Since October 2023, the European Union (EU) has had a new tool in its quest for decarbonization: the Carbon Border Adjustment Mechanism (CBAM). The adoption of this regulation, which will come into full effect in 2026, complements previous measures taken by the EU, such as the introduction of a carbon market andthe phasing out of free pollution permits, with the aim of combating « carbon leakage.«
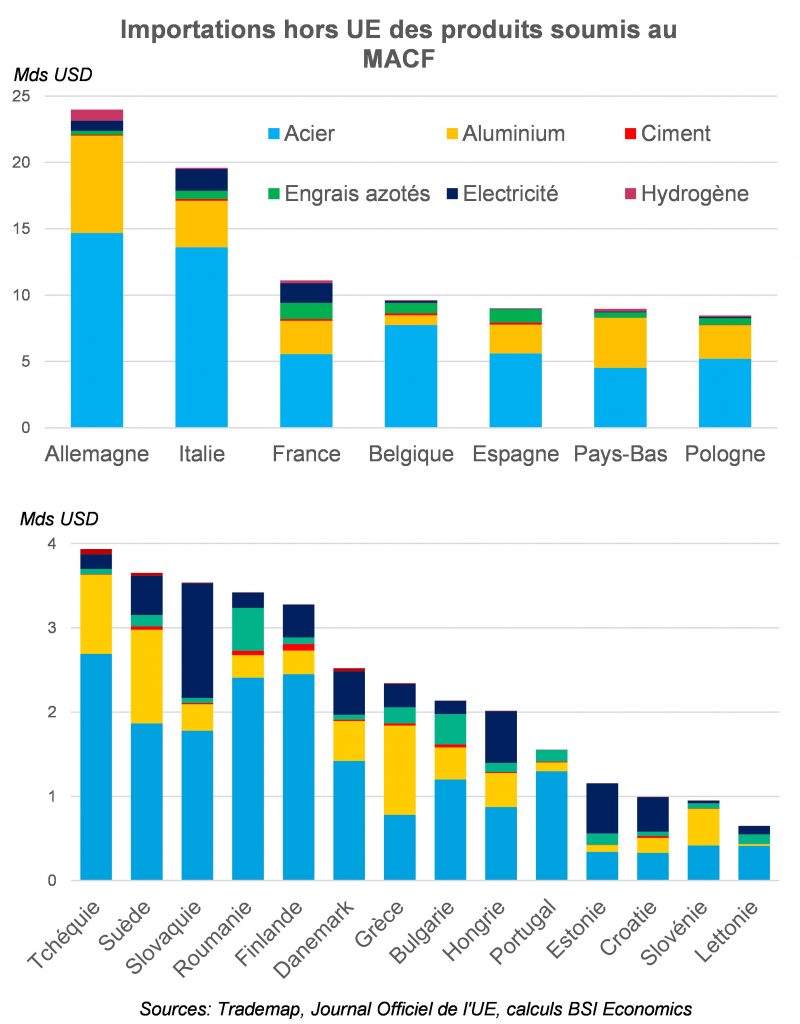
The CBAM aims to respond to the need to preserve the export competitiveness of European companies exporting to their EU partners. Indeed, given that few countries have a carbon market, goods produced outside the EU that do not include the cost of carbon in their price are potentially less expensive and therefore automatically more competitive than the same goods produced in the EU. To correct this distortion of competition, the MACF consists of applying a carbon price to imports from outside the EU that is equivalent to that applied within the EU (for more information on this subject, see the interview with economist T. Laboureau). At this stage, the MACF only applies to certain products from industries that are heavy emitters of greenhouse gases: metallurgy (steel and aluminum), cement, nitrogen fertilizers, hydrogen, and electricity (see chart below).

Although the mechanism appears to be « virtuous, » several studies (France Stratégie, Bpifrance, Rexecode) have revealed that the MACF only partially protects European industry and could even generate undesirable effects. These studies highlight in particular that European industries downstream of production chains would be particularly weakened by the MACF. The same would apply to industries that import goods with a view to processing them before exporting them to EU countries.
The aim of this series of articles, of which this is the first installment, is to provide an analysis of the various statistics available on the subject in order to determine who the potential winners and losers of the MACF might be.
Which countries are most affected by the MACF?
The first step is to identify the EU countries that import the most goods affected by the MACF from outside the EU. Importing a large amount of products from outside the EU automatically implies a high cost linked to the MACF (a cost borne by importing companies).

The first map above on the left (the intensity of blue determining the degree of exposure) shows, in terms of amounts, that the three largest EU economies, Germany (USD 24 billion), Italy (USD 19.6 billion), and France (USD 11.1 billion), have the highest amounts of products subject to the MACF. These amounts remain relatively low among countries further east.
However, when expressed as a percentage of industrial GDP, these amounts indicate a much higher level of exposure in eastern countries than in western countries. For the top three EU countries, the ratio as a percentage of GDP is below the European average of 6.8% of industrial GDP, but it is close to or more than double that in Bulgaria, Belgium, and Slovakia, and nearly triple that in Estonia. This is probably the most relevant measure for gaining an initial overview of the level of exposure to the costs associated with the MACF.
The third map above on the right offers another view of exposure, showing these amounts as a percentage of total non-EU imports. Once again, Eastern European countries have the highest ratios (nearly 12% in Croatia, Estonia, Latvia, Bulgaria, and Romania) and Italy (8%) also has a ratio above the European average (4.8%).
Which products are countries most exposed to the MACF?
A product-based approach also allowsusto visualize different levels of exposure (see graphs below). Metallurgical products subject to MACF (steel and aluminum) consistently account for the majority of MACF-subjected products imported from outside the EU, especially in Belgium for steel (80% of the total) and in the Netherlands and Sweden for aluminum (more than 30% of the total). The share of nitrogen fertilizers is relatively high in France, Spain, and Bulgaria, where it exceeds 10%. The share of electricity represents more than 30% in Slovakia, Estonia, and Croatia. For other products, the share is generally very low in all countries: it exceeds 2% of the total only in Spain and Croatia for cement and 3% in Germany for hydrogen. These differences can be explained by the high degree of heterogeneity in industrial structures between countries[7].
The cost of MACF depends not only on the amount of products imported but also on the carbon intensity of these products (see footnote 5). The higher the intensity, the more certificates a company will have to purchase and therefore the higher the cost. The case of metallurgical products (which include steel and aluminum) seems interesting to study, given the average weight of these products in total non-EU imports of products subject to the MACF (nearly 83% of the total).
Metallurgical products imported by EU countries from other EU countries have an average carbon intensity of 965 tons per million USD[8], compared to an average of 1,273 when imported from around the world (including the EU). With regard to metallurgical products, all EU countries have a higher carbon intensity for their imports from outside the EU than for those from within the EU. The cost of the MACF will be all the greater if these countries import a significant proportion of steel and aluminum from outside the EU. The graph below illustrates this: countries at the top of the graph have relatively higher carbon intensity (Greece, Lithuania, Bulgaria); those at the top right (Estonia, Italy), which import more than half of their metallurgical products from outside the EU, are the most exposed to the MACF for steel and aluminum.

Since the costs associated with the MACF are significant for countries that import a large proportion of their products from outside the EU, it is conceivable that imports from outside the EU could be at least partially replaced by imports within the EU. This would probably reduce the cost of carbon pricing at the border. Thus, the winners of the CBAM would be countries that export products subject to the CBAM and whose carbon intensity is lower on average.
While this observation seems logically uncontroversial, it is by no means guaranteed. Indeed, the intertwining of the MACF with other European mechanisms could thwart such a reorganization of trade, and the European « winners » of the MACF would instead be those who export outside the EU, while the « losers » would lose even more. These mechanisms will be described in a second note on the subject.
[1]For more information on this subject, see the sections on the evolution of the ETS Directive.
[2]This phenomenon of leakage consists of relocating the industries that emit the most greenhouse gases outside the EU so that these industries do not have to bear the costs associated with the new environmental standards.
[3]In this article, all calculations for steel subject to the MACF correspond to categories 72 (excluding 7202 and 7204) and 2601, in accordance with the Official Journal of the EU, representing nearly 80% of category 73. This choice was made to greatly facilitate analysis and calculations, given that the subcategories of category 73 not subject to the MACF represent on average between 2018 and 2022 19% of total exports within the EU and 21% outside the EU. The subcategories of category 73 affected by the MACF, which account for nearly 80% of the category, are as follows: 7301, 7302, 7303 00, 7404, 7305, 7306, 7307, 7308, 7309 00, 7310, 7311 00, 7318, and 7326.
[4] »At this stage, the MACF would not tax the carbon incorporated in most semi-finished and finished products imported from non-EU countries. For example, the carbon content of steel would not be « taxed » if it is incorporated into an imported car. C. Bellora and L. Fontagné (2022) estimate that European exports of intermediate products could fall by nearly 9% by 2040. However, the loss of export competitiveness would be limited for downstream activities that export to a non-EU country a processed product based on inputs covered by the MACF. « , T. Laboureau, Bpifrance (2023).
« The introduction of the MACF does not increase the import cost of products processed outside Europe from covered products, even if they are very carbon-intensive. The risk is therefore that it will profoundly disrupt processing sectors and even cause them to flee, for example, automotive production chains where machine manufacturers, encouraged to relocate to places where the metal products used as inputs and covered by the MACF are less expensive, will then import the processed products without paying any carbon adjustment at the border. » R. Trotignon and O. Redoulès, Rexecode (2023).
[5]An industry is said to be downstream of global production chains (GPCs) when it is close to the end of the production and/or distribution process. To measure the degree of integration of a country or industry downstream of GPCs, it is common to observe whether the share of imported and exported intermediate goods is significant or whether domestic value added is high in foreign exports.
[6]EU importers must purchase certificates from the European authority. The number of certificates depends on the amount of CO2 emissions contained in the imported product, which the importer and exporter will have measured or estimated upstream. The price of these certificates depends on the average price of CO2 emission permits in Europe or the carbon price difference between the EU and the countries in question, when the latter has a carbon market.
[7]For example: high imports of steel and aluminum for countries that are particularly integrated into international value chains in the automotive sector, such as Germany, Italy, and the Czech Republic; a large agricultural sector, as is the case in Bulgaria and Romania, requires significant amounts of fertilizer.
[8]According to data from the Organization for Economic Cooperation and Development (OECD) TiVA database for the latest year available.