Summary:
– The vast majority of developed countries, as well as some developing countries, are currently facing an aging population.
– This essentially translates into an increase in the proportion of elderly people in the total population.
– In this article, we will show how this dynamic tends to negatively affect gross domestic product (GDP) per capita and therefore its growth.
– Finally, we highlight the forces that can counteract the negative effect of this demographic change.
Population aging is a phenomenon that affects virtually all developed economies. In the current debate, for example, there is often talk of reforms aimed at extending working life. In this article, we show that the justification for this type of reform is essentially due to the fact that aging has a mechanical negative effect on GDP per capita and its growth. To illustrate this point, we present GDP in the form of simple equations that include the demographic component of aging.
Aging : aninternational overview
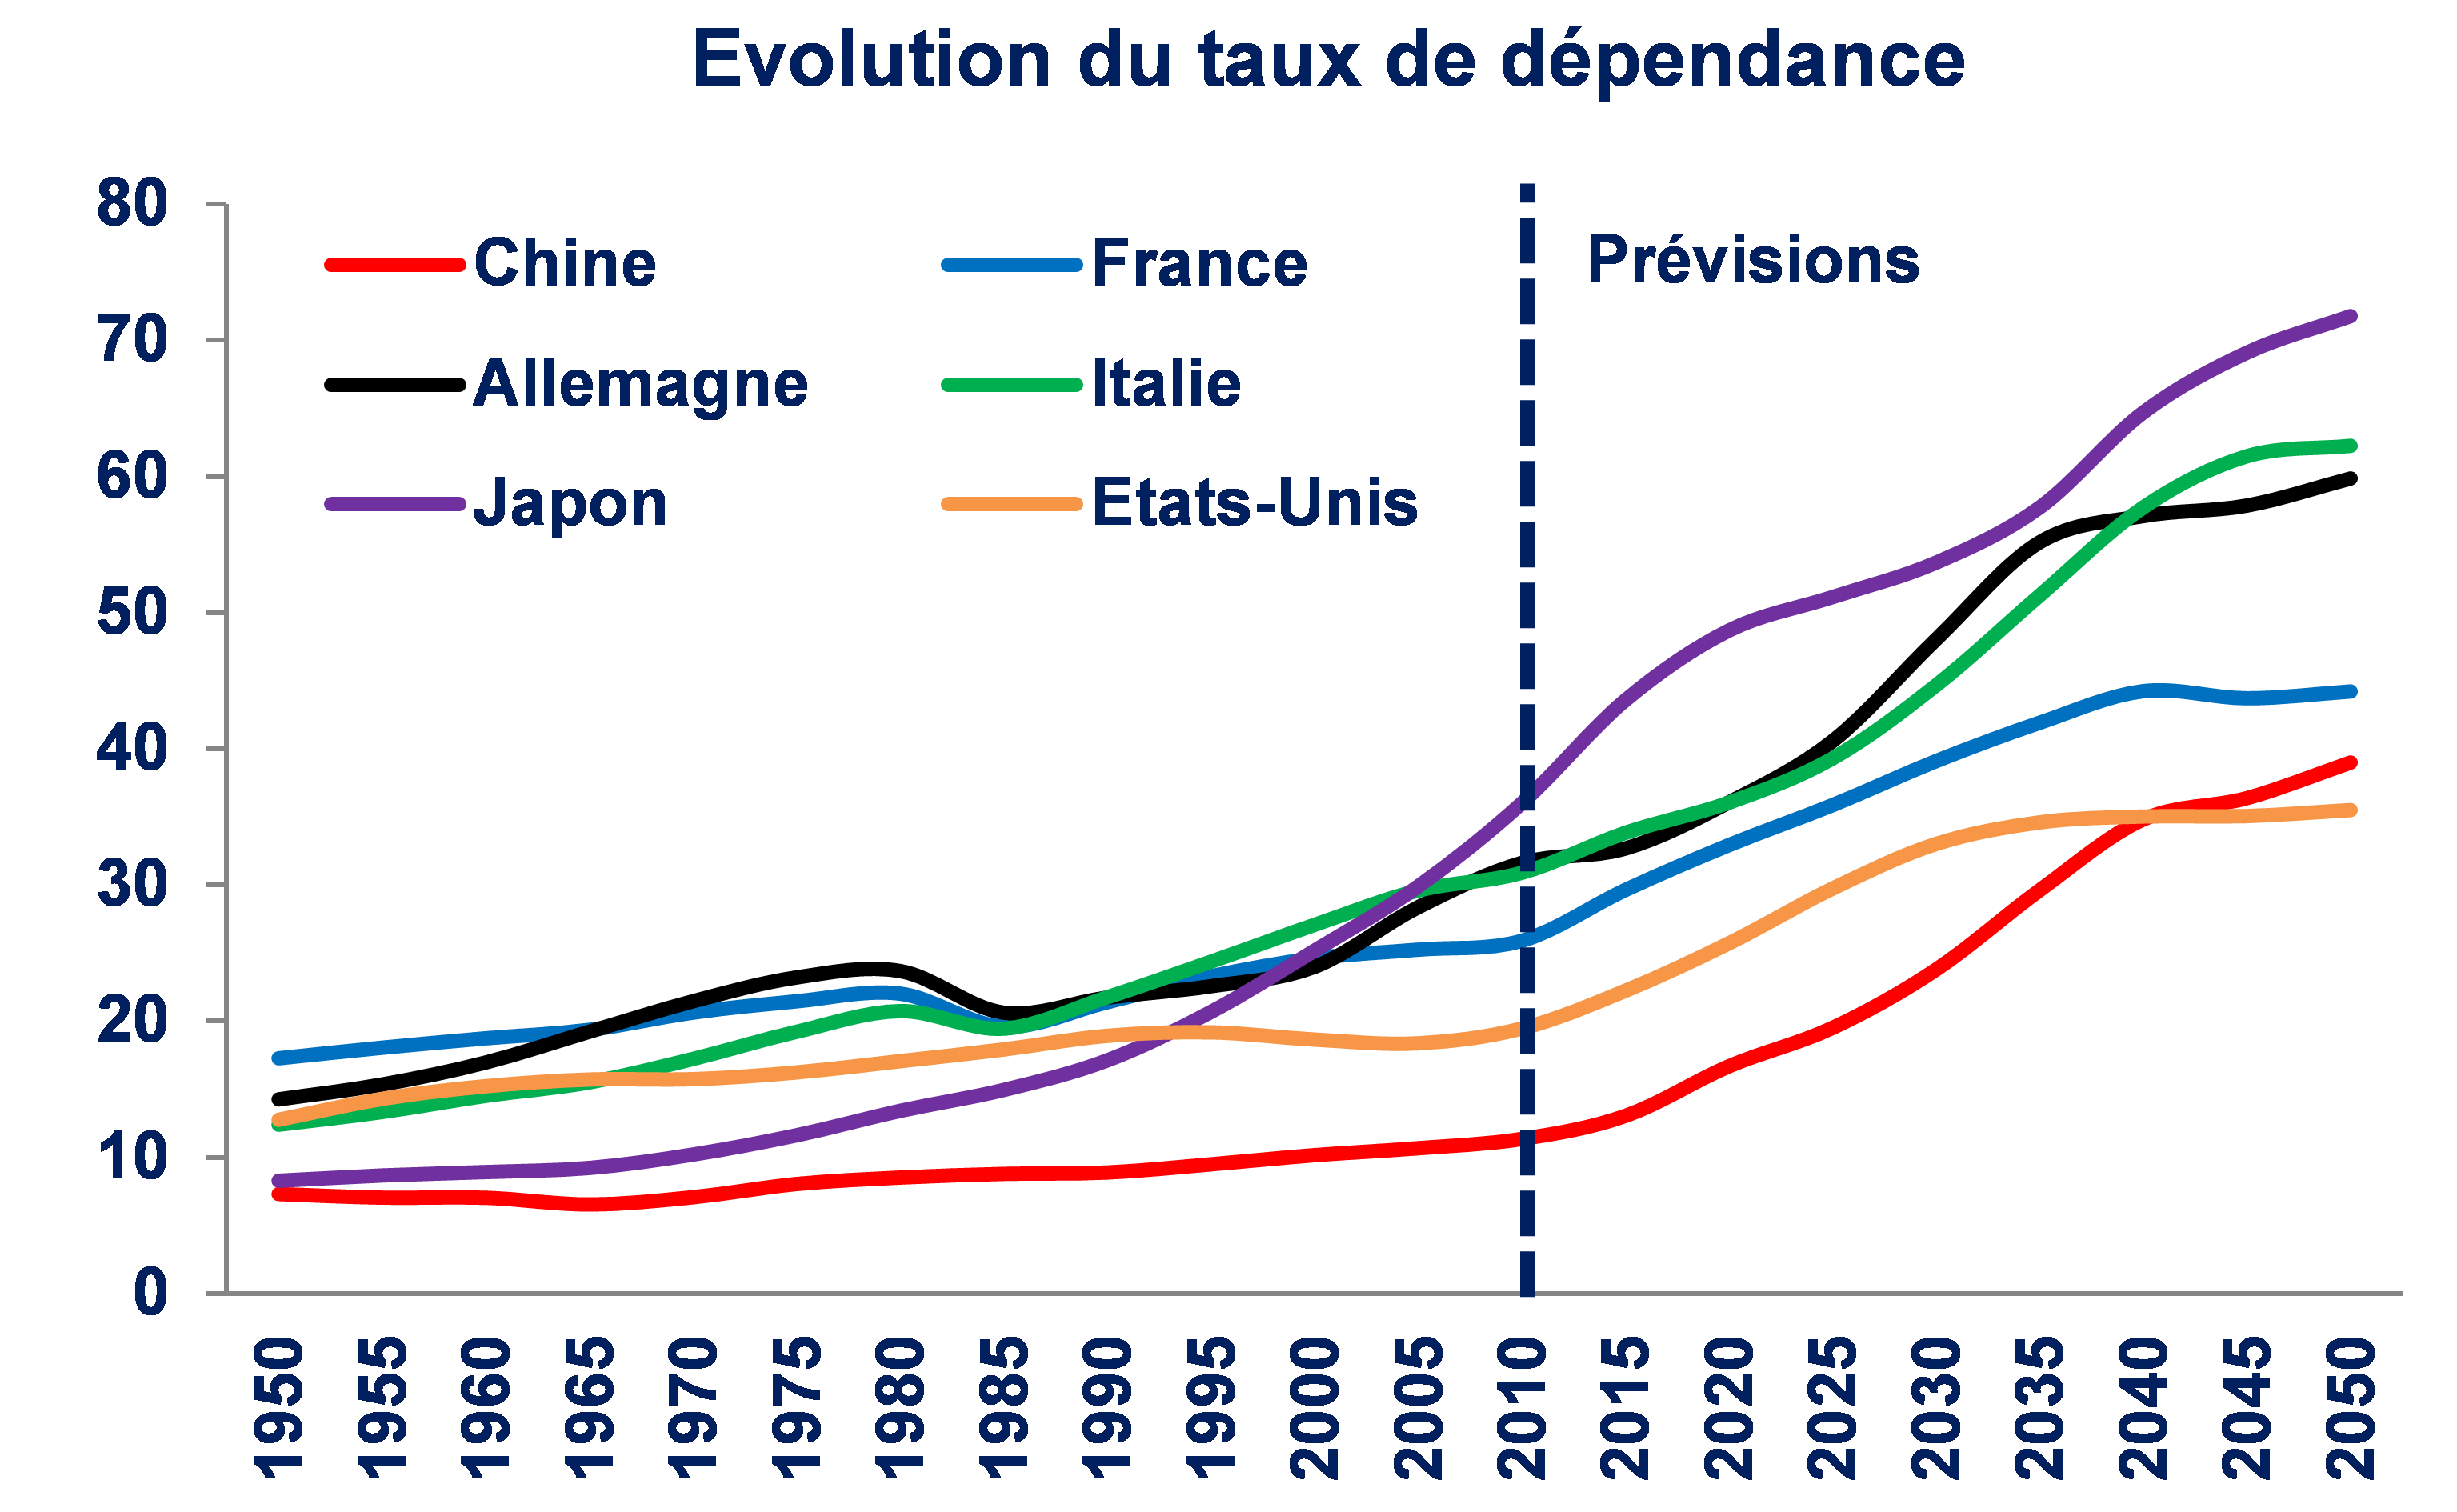
The following graph shows the evolution of the ratio of people over 65 to the population aged 15 to 64 for different countries: China, France, Germany, Italy, Japan, and the United States. The data after 2010 are projections of the evolution of this ratio (which we will call the dependency ratio).
In all these countries, the dependency ratio is expected to increase in the coming years. The countries where this ratio is expected to be highest are clearly Japan, Italy, and Germany. In general, in all the countries presented except France, this dependency ratio is expected to almost double, or even more, by 2050. Two parallel trends are at work in developed countries: the baby boom and longer life expectancy, thanks in particular to increased healthcare spending. In China, part of the change is due to the one-child policy.
Sources: UN, BSI Economics
(Data after 2010 are projections)
GDP in equations
To understand how aging affects GDP per capita, it is essential to use a few simple equations. In this section, we will break down GDP per capita step by step so that readers can understand how it can be influenced by aging. First, we can define GDP as follows:
GDP =Average hourly productivity per worker * Average number of hoursworked per worker * Number of workers
This equation means that what a country produces in a year is equal to what a worker produces on average in an hour, multiplied by the average number of hours worked by each worker, multiplied by the total number of workers in the economy.
GDP is certainly an important measure, but economists are often more interested in GDP per capita (or per person), which is calculated as follows:
GDP per capita = GDP / Total population
GDP per capita therefore measures the production per inhabitant of an economy. An identical GDP per capita between two countries generally indicates similar levels of development[1]. We can rewrite our measure of GDP per capita (i.e., the wealth of individuals in a country) using our first equation:
GDP per capita =Average hourly productivity per worker * Average number of hoursworked per worker
* (Number of workers / Total population)
Aging affects GDP per capita via the term in parentheses, which we can rewrite as:
Number of workers / Total population = Working-age population * Employment rate / Total population
The employment rate refers to the proportion of people of working age who are in employment. This ultimately allows us to rewrite GDP per capita as follows:
GDP per capita =Average hourly productivity per worker * Average number of hoursworked per worker
* Employment rate * ( Working-age population / Total population)
This last equation is fundamental to understanding the impact of aging on GDP per capita. Aging reduces the proportion of the working-age population in the total population (the last term in parentheses). All other things being equal, it therefore has the effect of reducing the level of GDP per capita.
Let us imagine a world in which the following factors remain constant: average hourly productivity per worker, average number of hours worked per worker, and employment rate. In this world, the gradual aging we are currently observing would automatically lead to negative growth in GDP per capita if the average retirement age remained constant.
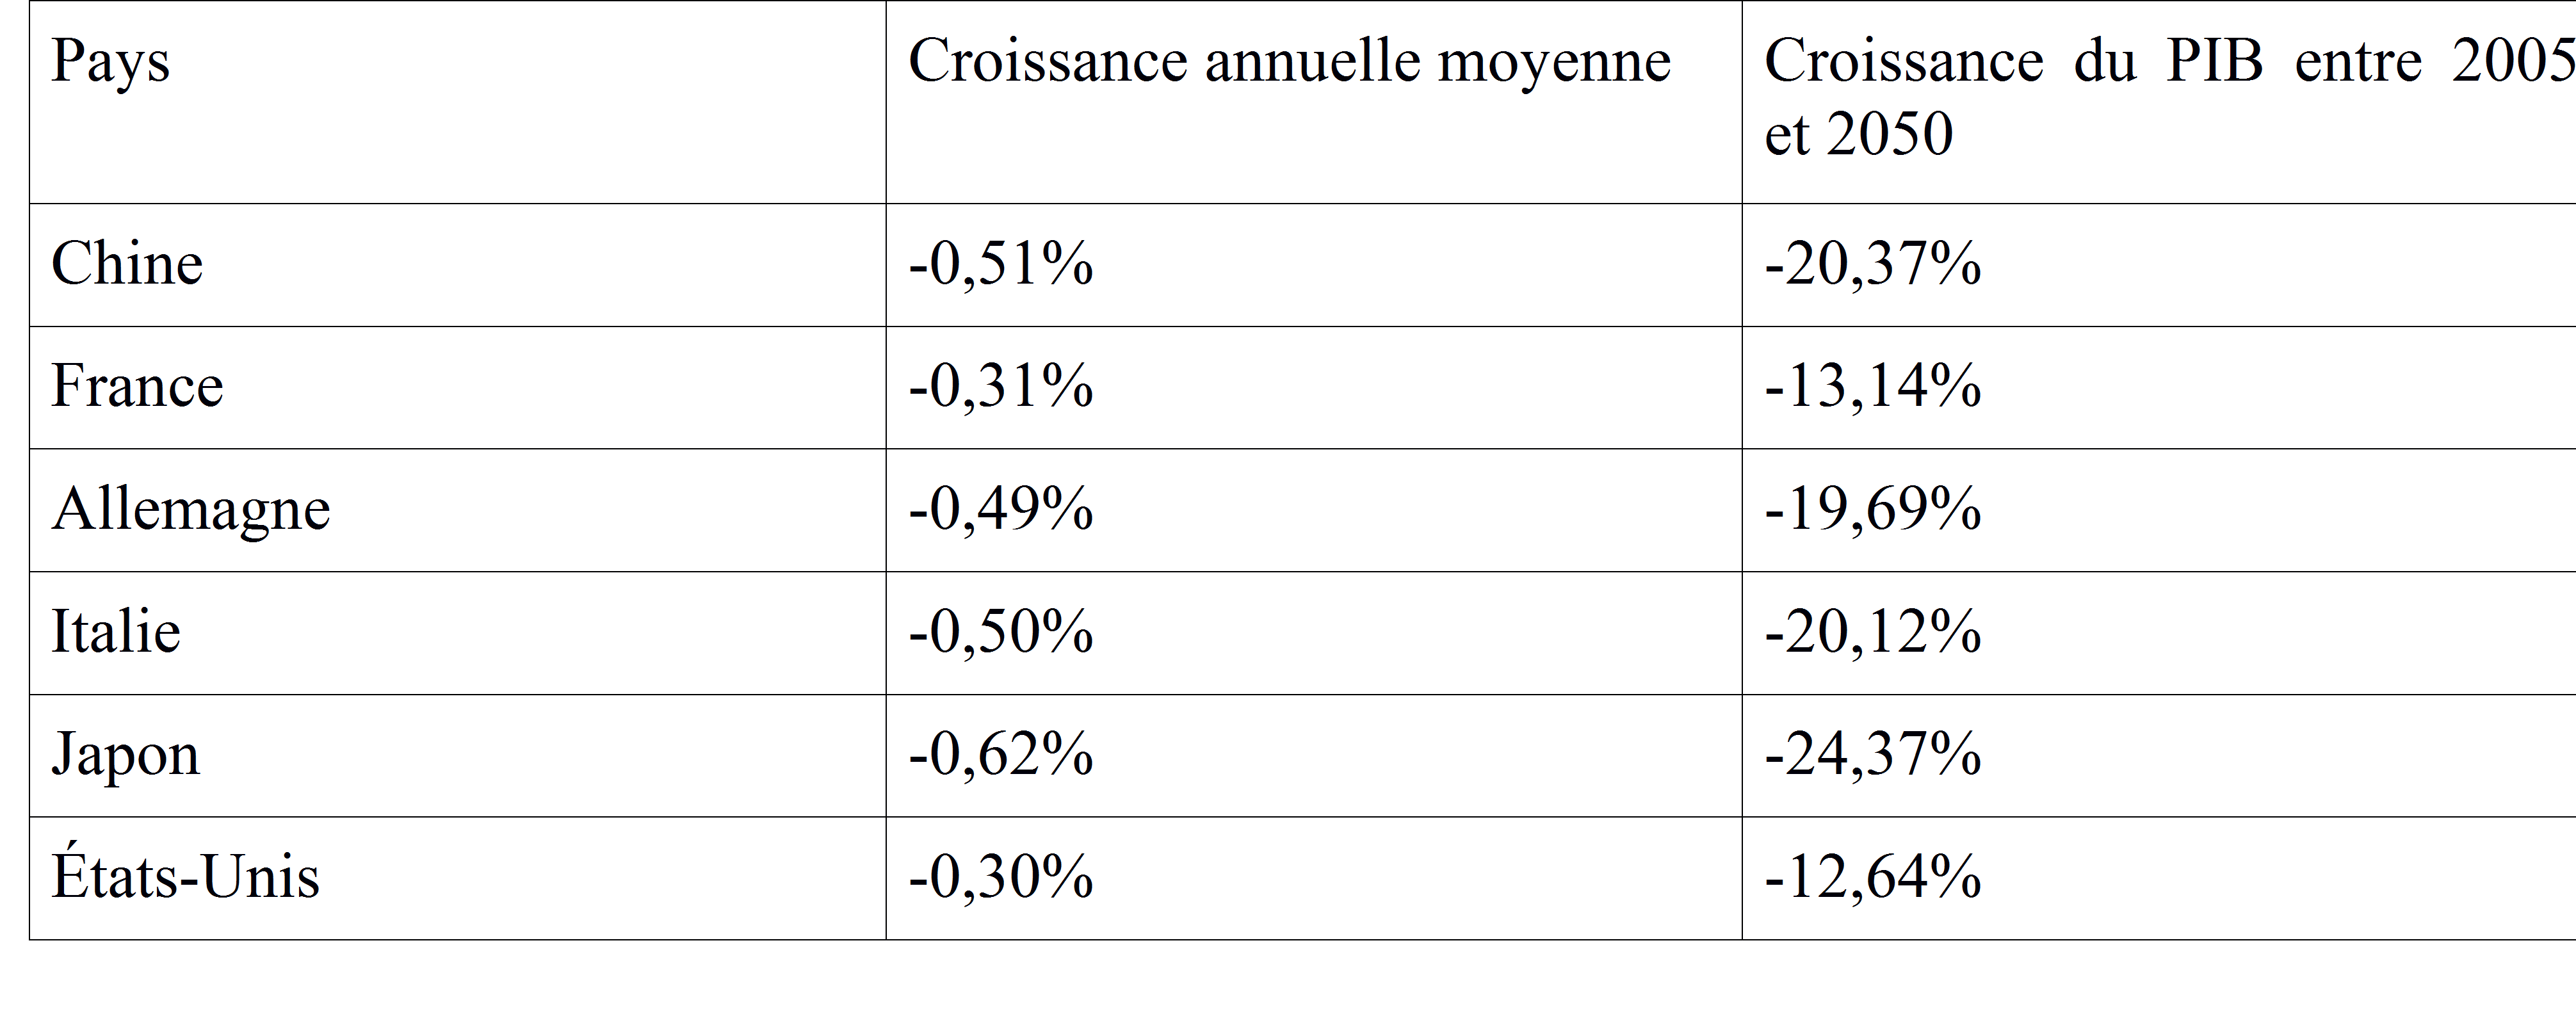
For France, a simple calculation[2]suggests that, all other things being equal, aging would lead to average annual GDP per capita growth of -0.31% between 2005 and 2050. Ultimately, this would result in a reduction in GDP per capita of -13.14% between 2005 and 2050. The figures for other countries are presented in the table below:
Effects of aging on growth
Sources: UN, BSI Economics. Author’s calculations.
What solutions are there to combat aging ?
In the previous section, we showed the negative impact of aging on growth. It is interesting to compare the above figures with those for annual growth in hourly labor productivity[3]. Over the period 2007-2012, growth was around 0.3% in the eurozone, compared with 1.18% over the period 1995-2007.
A 0.3% increase in hourly labor productivity can, at best, only offset a decline in the ratio of workers to the total population of the same magnitude. This would be insufficient for a country such as Germany and would therefore lead to negative growth without further adjustment. We can, of course, hope for a more favorable trend in hourly labor productivity growth. However, the long-term trend is rather negative, with levels generally falling.
Let’s return to our last equation to better understand what types of policies can enable us to offset the negative effect of aging on GDP per capita.
GDP per capita =Average hourly productivity per worker * Average number of hoursworked per worker
* Employment rate * ( Working-age population / Total population)
The first type of policy that can be implemented is one that aims to increase hourly productivity per worker. This can be done in various ways. In particular, we can think of improving the education system, improving vocational training during working life, and/or reducing certain barriers to innovation. Ultimately, the latter may be key, and it may be necessary to promote investment in research and development in order to at least maintain the level of GDP per capita. These policies are often long-term and can have variable and uncertain results. However, they remain the ones most closely linked to the notion of progress.
A second possibility is to increase the average number of hours worked per worker. In France, the average number of hours worked is around 28.5 hours per week. This figure can be increased through several levers: reducing part-time work, increasing the legal working week, incentives for overtime, etc. Even if the political debate in France in particular raises the question of the legal working week, the fact remains that this is a controversial issue, particularly because the reduction in working hours was one of the positive developments of economic progress.[4].
A less controversial policy is one aimed at increasing the employment rate. One way to increase the employment rate would be to reduce the unemployment rate, which is currently high in France (10.4% of the working population) and tends to reduce GDP per capita. Of course, in reality, this is complex. To increase the employment rate, policies could also be implemented to increase the participation rate of women in the labor market, for example.
Finally, a decision could be made to increase the proportion of the working-age population in the total population. There are essentially two solutions (in the medium term). The first is to extend working life, which is a general trend in most developed countries. The second is an immigration policy aimed at bringing in workers from other countries.[5].
The issue of GDP per capita is closely linked to that of the sustainability of pension systems. In a pay-as-you-go system, in order to maintain a « generous » pension system, it is necessary to keep GDP per capita at a high level. France has made several efforts in this regard: raising the legal retirement age to 62 and increasing the contribution period to 43 years in order to obtain a full pension. However, we are currently seeing that supplementary pension schemes are running out of funds[6]. Similarly, although the Pension Advisory Council (COR) has recently been rather optimistic about the general scheme[7], the fact remains that most forecasts are based on optimistic assumptions. For example, with an unemployment rate of 7% and labor productivity growth of 1.3% per year, the system would be in constant deficit over the next 40 years. Given that unemployment in France is currently over 10% and that labor productivity growth[8] was only 0.27% per year over the period 2007-2012, and that productivity growth has steadily declined over the last fifty years, it is possible to be somewhat skeptical about the sustainability of our pension system as it stands.
This is not to be alarmist. However, it is true that the continuation of an environment of low productivity growth with even a moderate (for France) unemployment rate of 7% would automatically raise questions about raising the retirement age, increasing contributions, or reducing benefits. Indeed, if, for example, productivity growth proves too weak, the negative effect of demographics on per capita GDP could lead to painful trade-offs between generations (active vs. inactive).
Conclusion
In conclusion, we have seen that population aging will automatically have a negative effect on growth in most developed economies and some developing economies (China, for example). There are four levers to counter this trend:
– increase average hourly productivity per worker,
– increase the number of hours worked per worker,
– increasing the employment rate,
– increasing the number of individuals of working age by extending working life or implementing immigration policies.
Notes
[1] Of course, other development indicators exist, such as the HDI (Human Development Index). However, for the sake of simplicity, we will limit ourselves here to GDP as a measure of well-being. Taking other indicators into account should not, however, alter the main conclusions of this article.
[2]Author’s calculations. These figures are intended primarily as illustrations, and we caution readers not to overinterpret them. All other things being equal, we have:
(GDP per capita in t – GDP per capita in t-1) / GDP per capita in t-1 =((Working-age population in t / Total population in t) – (Working-age population in t-1 / Total population in t-1)) / (Working-age population in t-1 / Total population in t-1).
Assuming that: Working-age population in t / Total population in t =1/(1+ dependency ratio in t), ( i.e., we do not take into account changes in the population under 18), the above formula gives:
GDP growth per capita in t and t-1 = (1+dependency ratio in t-1)/(1+dependency ratio in t) – 1.
Therefore, the higher the dependency ratio in t is compared to that in t-1, the lower the growth will be.
[3 ]http://www.strategie.gouv.fr/sites/strategie.gouv.fr/files/archives/jpf-27-septembre-2013.pdf
[4] In fact, economic progress has generally been accompanied by a decrease in the number of hours worked per week. This trend can be explained by increased labor productivity, which has enabled individuals to produce more in less time and thus enjoy more free time.
[5] On this subject, see the recent BSI article: http://www.bsi-economics.org/index.php/macroeconomie/item/445-defi-demographique-allemagne.
[6]http://www.lesechos.fr/journal20141219/lec1_france/0204026929816-retraites-complementaires-lappel-au-courage-de-la-cour-des-comptes-1076662.php
[7]http://www.lesechos.fr/economie-france/social/0204018512872-retraite-les-previsions-un-peu-moins-alarmistes-du-cor-1075263.php
[8] See http://www.strategie.gouv.fr/sites/strategie.gouv.fr/files/archives/jpf-27-septembre-2013.pdf
[9]
References:
A debate has recently begun among economists in the United States as to whether productivity growth will be able to offset the negative effects of demographics, among other things. This debate was launched in particular by economist Robert Gordon. See in particular the article:
http://economics.weinberg.northwestern.edu/robert-gordon/NBER%20P383F%20Sequel_140126.pdf
and other articles on his website:
http://economics.weinberg.northwestern.edu/robert-gordon/researchhome.html