Summary:
– A social investment strategy consists of equipping individuals with the skills and knowledge necessary for the labor market so that they can be employed as often as possible.
– The European Commission recommends implementing a social investment strategy.
– Social investment expenditure ranged from 6% to 18% of GDP across Member States in 2010 and is positively correlated with the employment rate of 15-64 year olds.
– Some European countries appear to be more efficient in terms of social investment spending and results. France must find a way to redirect its social protection spending towards social investment at a time of public spending controls.

In 2010, the European Commission and the Member States adopted the Europe 2020 strategy. This strategy, which will run for a period of ten years (from 2010 to 2020), aims to create a smart, sustainable, and inclusive economy in the European Union (European Commission, 2010). As part of this strategy, the European Union has set itself several objectives, including reducing the number of people living in poverty and exclusion by at least 20 million between 2010 and 2020. However, the crisis has undermined this objective. The number of people affected by poverty and social exclusion across the European Union has increased rather than decreased. According to Eurostat, it rose from 116 million in 2008 to 122 million in 2012.
The increase in poverty and social exclusion is mainly due to the effects of the crisis on the labor market. By damaging the labor market, the crisis has led to a sharp increase in the unemployment rate—between 2007 and 2013, the European unemployment rate rose from 7.2% to 10.9%.[1], depriving part of the population of income from work.
In response to the deterioration of the labor market and its link to the evolution of poverty and social exclusion, the European Commission has highlighted the need to implement a social investment strategy within Member States (European Commission, 2013). This strategy should improve people’s training and equip them with the skills and knowledge they need to find employment. By reducing the incidence of unemployment, this strategy appears to be a key element in the fight against poverty and exclusion. Furthermore, by equipping all individuals, regardless of their social background, with the skills they need to find employment from an early age, this strategy should reduce the repair costs inherent in unequal societies.
This article proposes to define what social investment is. It then examines the relationship between the level of social investment expenditure on the one hand, and the employment rate and monetary poverty rate on the other. Before concluding, it looks at which countries are the mostefficientin terms of social investment expenditure and results.
1/ What is social investment?
According to the European Commission, social investment is one of the functions of the social protection system (European Commission, 2013). It should « strengthen people’s capabilities and support their participation in society and the labor market. » In other words, social investment encompasses policies that prepare individuals for the difficulties they will encounter throughout their lives, rather than repairing the consequences. Collective childcare for very young children (under 3 years of age) is often cited as an example of a social investment strategy. Indeed, as shown by the work of James Heckman, winner of the Nobel Prize in Economics, collective childcare for very young children improves the development of cognitive abilities, which in turn facilitates integration into the labor market. Lifelong learning is also an important part of a social investment strategy.
The European Commission’s definition of social investment is broad and can encompass a wide variety of social protection expenditures. Kvist (2013) proposes a slightly different definition: social investment corresponds to « policies that improve or provide individuals with more skills/knowledge and enable them to use and maintain these skills/knowledge. » De Deken (2012) is the first to provide a list of social protection expenditures to be included in a social investment indicator, which can serve as a blueprint for its development.
Based on this work and Eurostat’s ESPROSS database, it is possible to develop a social investment indicator that includes social protection expenditure related to labor market participation and active aging, work-life balance, early childhood, and education.
2/ What is the level of social investment expenditure in Europe?
The graph showing social investment expenditure as a percentage of GDP highlights the different strategies adopted by Member States. In 2010, social investment expenditure amounted to 11.3% of GDP in France (Graph 1). This places the country among the Member States with a relatively high level of social investment expenditure (the average for the countries available is 9.4%), although it remains below Austria (12.3%), Finland (13.5%), Sweden (15.9%) and Denmark (18.7%).
Graph: Share of social investment expenditure in GDP in 2010 (in %)
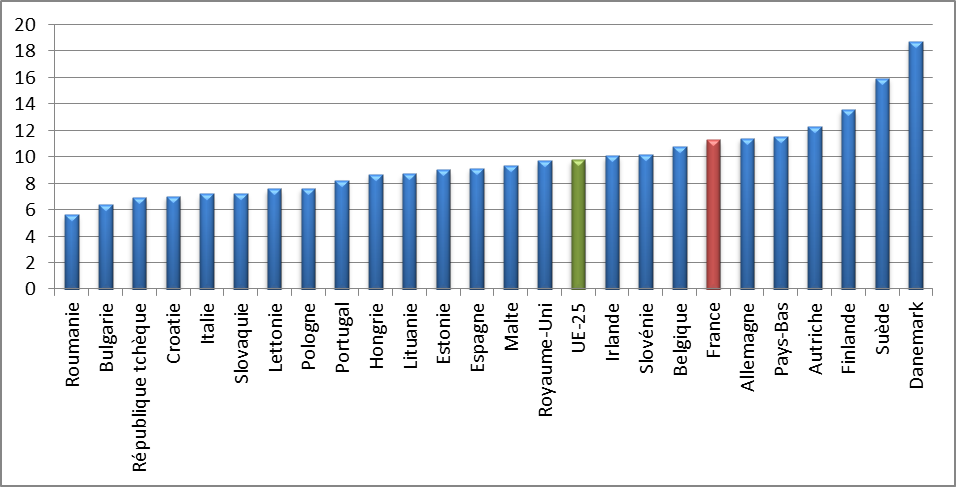
Note: The figure for the United Kingdom is for 2009
Source: Eurostat, Macrobond BSI Economics, author’s calculations
However, if we look at the share of social investment expenditure in social protection expenditure (graph 2), France appears in the bottom third. In 2010, this expenditure represented 29.8% of total social protection expenditure. This places France below the European average (32.5%) and far behind Sweden (43.1%) and Denmark (45.6%). These two countries, along with Finland, are the countries with the highest social investment expenditure (in terms of % of GDP) and the largest share of social investment expenditure in social protection expenditure.
Graph: Share of social investment expenditure in social protection expenditure (in %)
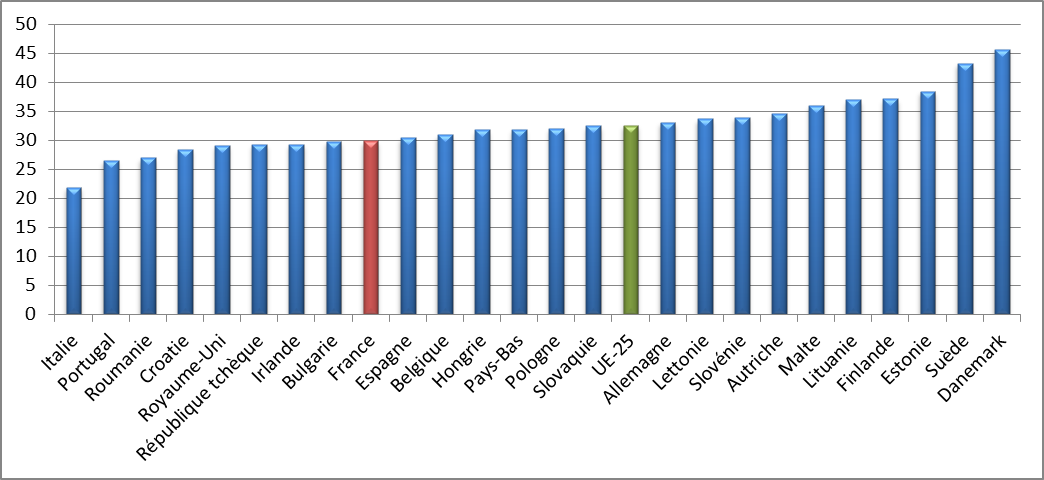
Note: Figures for the United Kingdom are for 2009
Source: Eurostat, Macrobond, BSI Economics, author’s calculations
In light of the European Commission’s recommendations, it would appear that France still has some way to go if it truly wishes to embark on a social investment strategy. To do so, it would need to redirect its social protection spending towards greater social investment.
3/ Is there a relationship between social investment spending and employment rates?
In order to determine whether France should move towards a social protection system that is more focused on social investment, it is necessary to ensure that this will deliver the expected results.
Figure 3 shows the correlation between the level of social investment spending and the employment rate for 15-64 year olds in 2010. There appears to be a clear positive relationship between these two indicators. In other words, increased investment spending appears to go hand in hand with an increase in the employment rate. Calculating the correlation coefficient gives a result of 0.73.
The employment rate for older people (aged 55-64) is lower than for the rest of the population (50.1%[2]compared to 64.1% in Europe in 2013). This population group therefore appears to be a prime target for social investment aimed at keeping them in employment. Focusing solely on the 55-64 age group, the positive relationship between the employment rate and social investment expenditure appears to persist (Figure 4). However, it is weaker than for the general population, with a correlation coefficient of 0.59.
Graph: Correlation between the employment rate of 15-64 year olds and social investment expenditure as a percentage of GDP in 2010
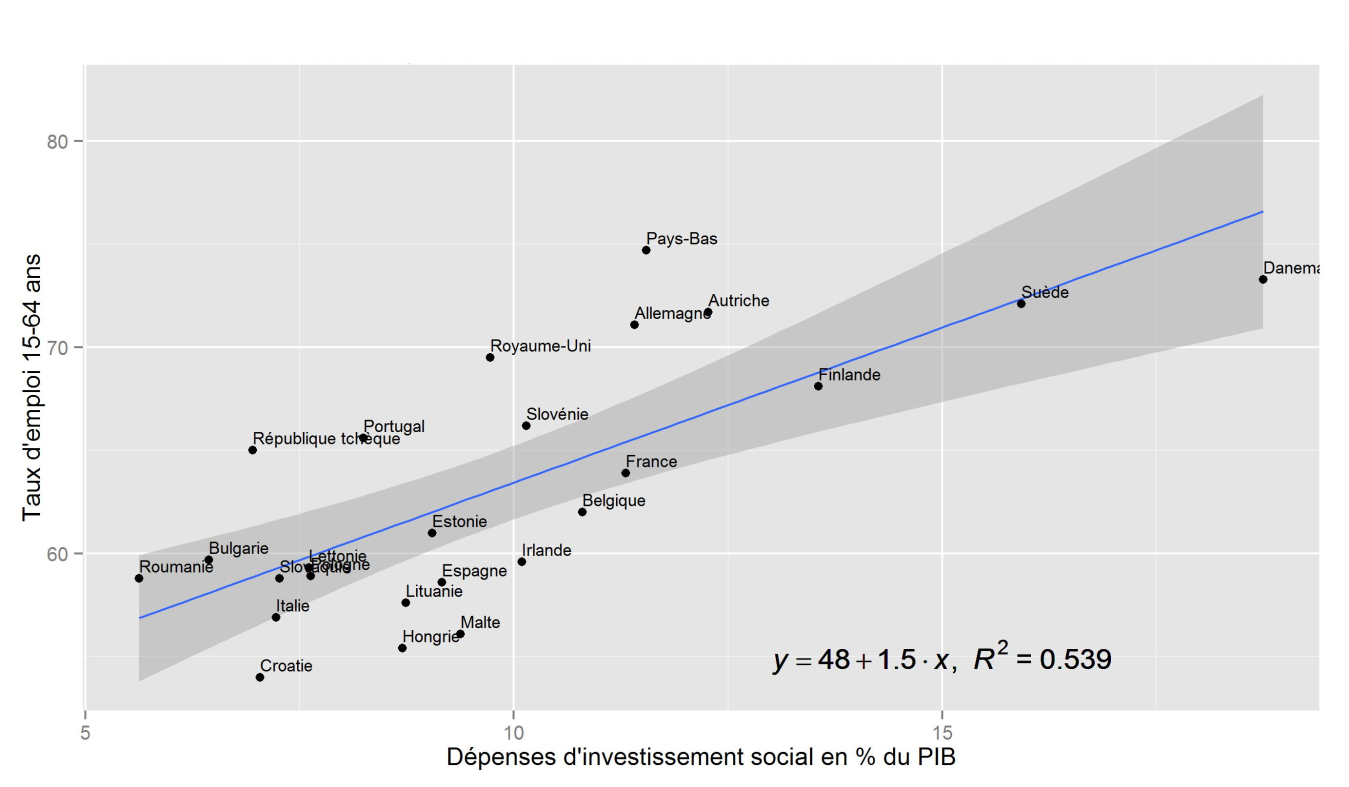
Note: For the United Kingdom, the year is 2009
Source: Eurostat, Macrobond, BSI Economics, author’s calculations
Graph: Correlation between the employment rate for 55-64 year olds and social investment expenditure as a percentage of GDP in 2010
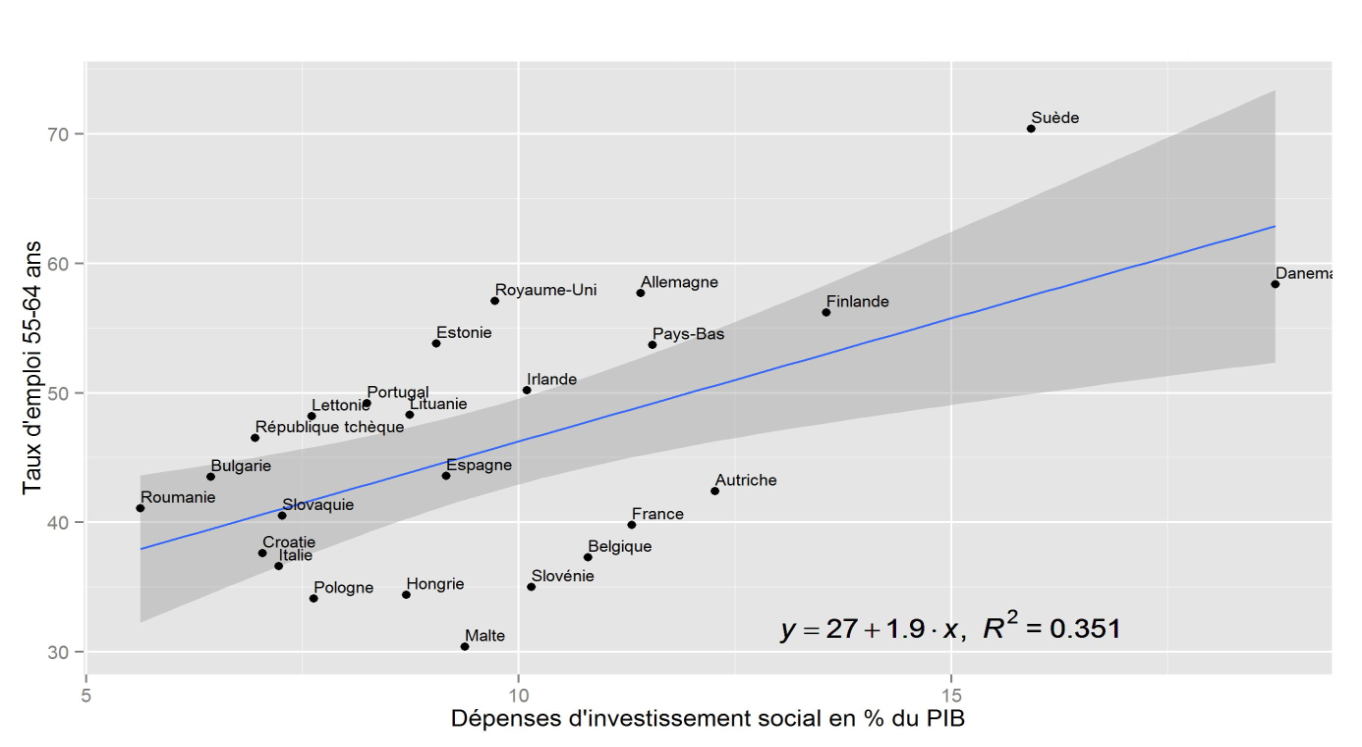
Note: Data for the United Kingdom is for 2009
Source: Eurostat, Macrobond, BSI Economics, author’s calculations
Comparing the long-term unemployment rate[3]of the labor force and the level of social investment expenditure (as a percentage of GDP), we see a negative correlation (Figure 5). In other words, the more social investment expenditure increases, the lower the long-term unemployment rate. The correlation coefficient this time is -0.55.
Graph: Correlation between long-term unemployment rate and social investment expenditure as a percentage of GDP in 2010
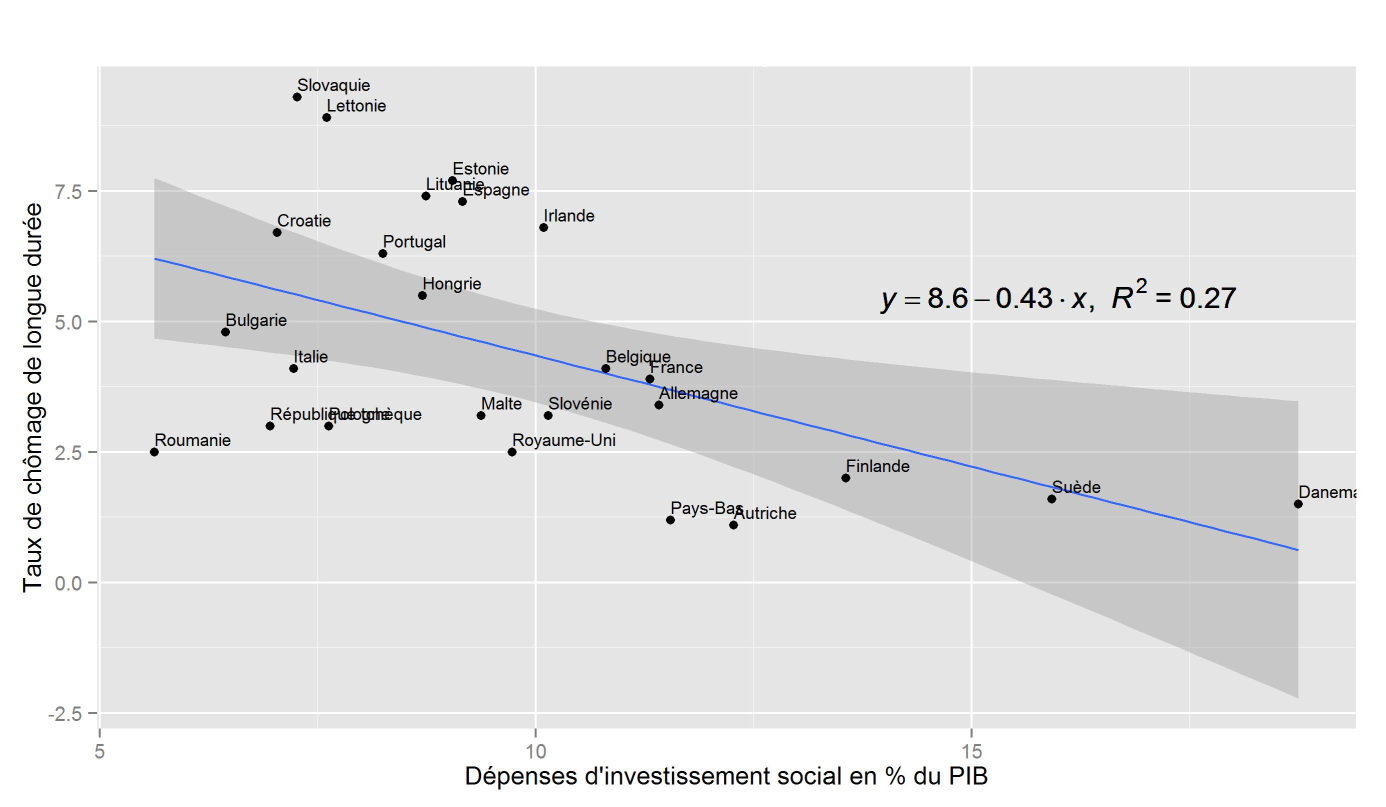 .
.
Note: For the United Kingdom, the year is 2009
Source: Eurostat, Macrobond, BSI Economics, author’s calculations
While there appears to be a negative relationship between the level of social investment spending and the monetary poverty rate (Figure 6), this relationship appears to be weaker than those tested previously. This is undoubtedly due to the fact that monetary poverty is not solely attributable to the labor market situation. Other factors unrelated to social investment also play a role in the formation of poverty (family composition, type of employment, etc.).
Graph Correlation between monetary poverty rate (60% threshold) and social investment expenditure as a percentage of GDP in 2010
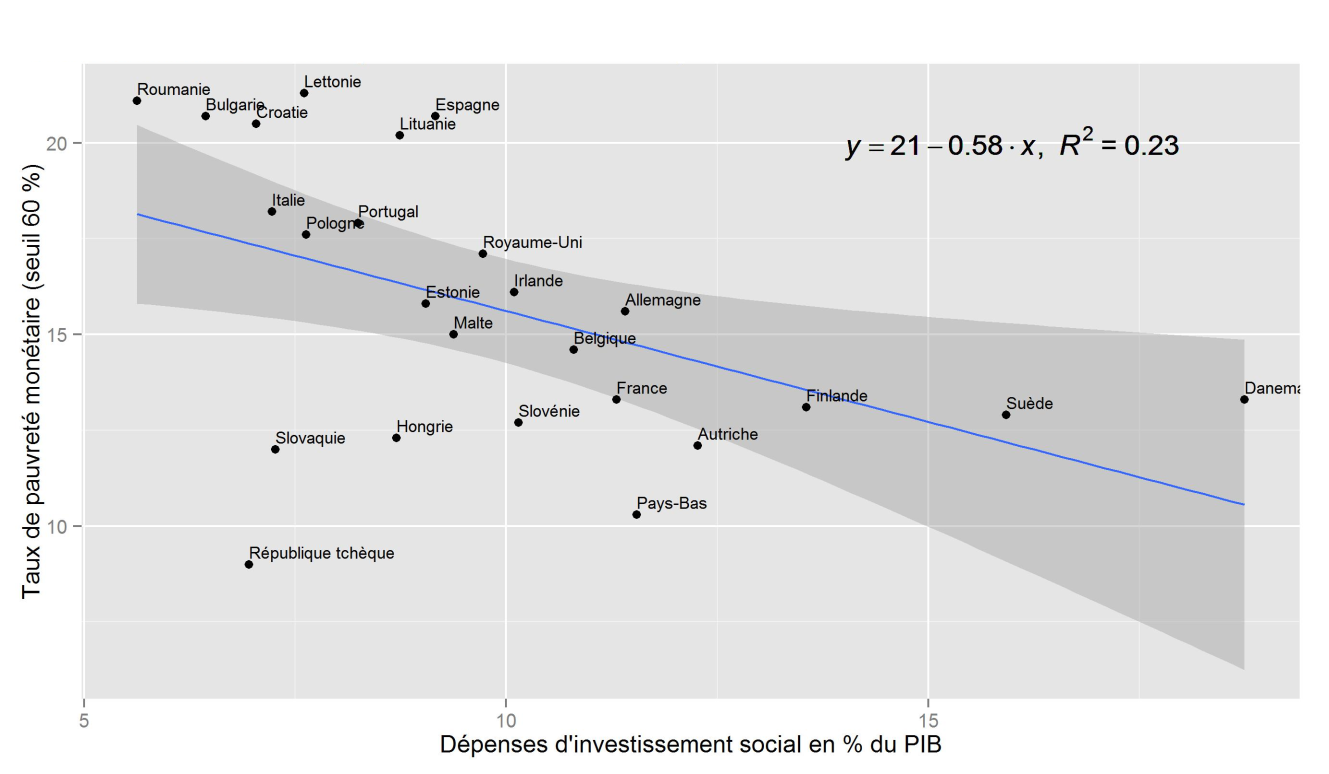
Note: For the United Kingdom, the year is 2009
Source: Eurostat, Macrobond BSI Economics, author’s calculations
4/ Which countries are the most efficient in terms of social investment expenditure?
Based on the above results, it appears that investment spending is correlated with the employment rate of 15-64 year olds. Therefore, if the objective of Member States is to improve the employment rate of the population in order to reduce poverty, social protection spending should be directed towards social investment. However, there is no single model for social investment, and some countries are more efficient than others in their spending. It is therefore useful to study the efficiency of social investment models within the European Union in order to position France and identify the most efficient countries.
Efficiency frontier analysis, using the non-parametric DEA (Data Envelopment Analysis) approach (Sutherland et al. 2007), makes it possible to assess a country’s position relative to a predetermined sample. In other words, the efficiency frontier allows us to compare one country with others in terms of efficiency—the difference between what is invested (input) and the results obtained (output). This statistical technique does not involve making any prior assumptions, but it does have certain limitations (sensitivity to measurement errors and outliers).
There are two possible approaches to efficiency frontier analysis. The first consists of looking at how much the results of the country in question can be improved while keeping its inputs (i.e., social investment expenditure) constant; this is the « output-oriented » approach. The second (input-oriented approach) measures how much it would be possible to reduce inputs for the same level of results (employment rate). The efficiency frontier represents best practices; the distance to the frontier is measured by a percentage score (Joumard et al. 2008). Countries on the efficiency frontier have, by definition, a score of 100%.
Figure 7 shows the efficiency frontier in a single-input configuration, social investment expenditure as a percentage of GDP, and an outcome indicator, the employment rate of 15-64 year olds. According to this approach, the most efficient countries, or those with the best practices in the sample, are the Netherlands, the Czech Republic, and Romania. These three countries have the highest employment rates with the lowest level of social investment expenditure. Using the output-oriented approach, France has a score of 86.1%. This places the country18thamong the least efficient European countries. Using the input-oriented approach, France scores 59.4%, ranking it22nd. France therefore appears to be relatively inefficient compared to other European countries: it has a relatively low employment rate compared to its level of social investment. If France were as efficient as the countries on the efficiency frontier, it could achieve the same employment rate by reducing its current level of social investment (11.3% in 2010) by 40.6%, i.e., to a level of around 6.7% of GDP. If it decides to keep its level of social investment expenditure constant, it could increase the employment rate by 12.5 percentage points, i.e., reach 76.4% instead of 63.9% in 2010.
Graph: Social investment, distance to the frontier of efficiency
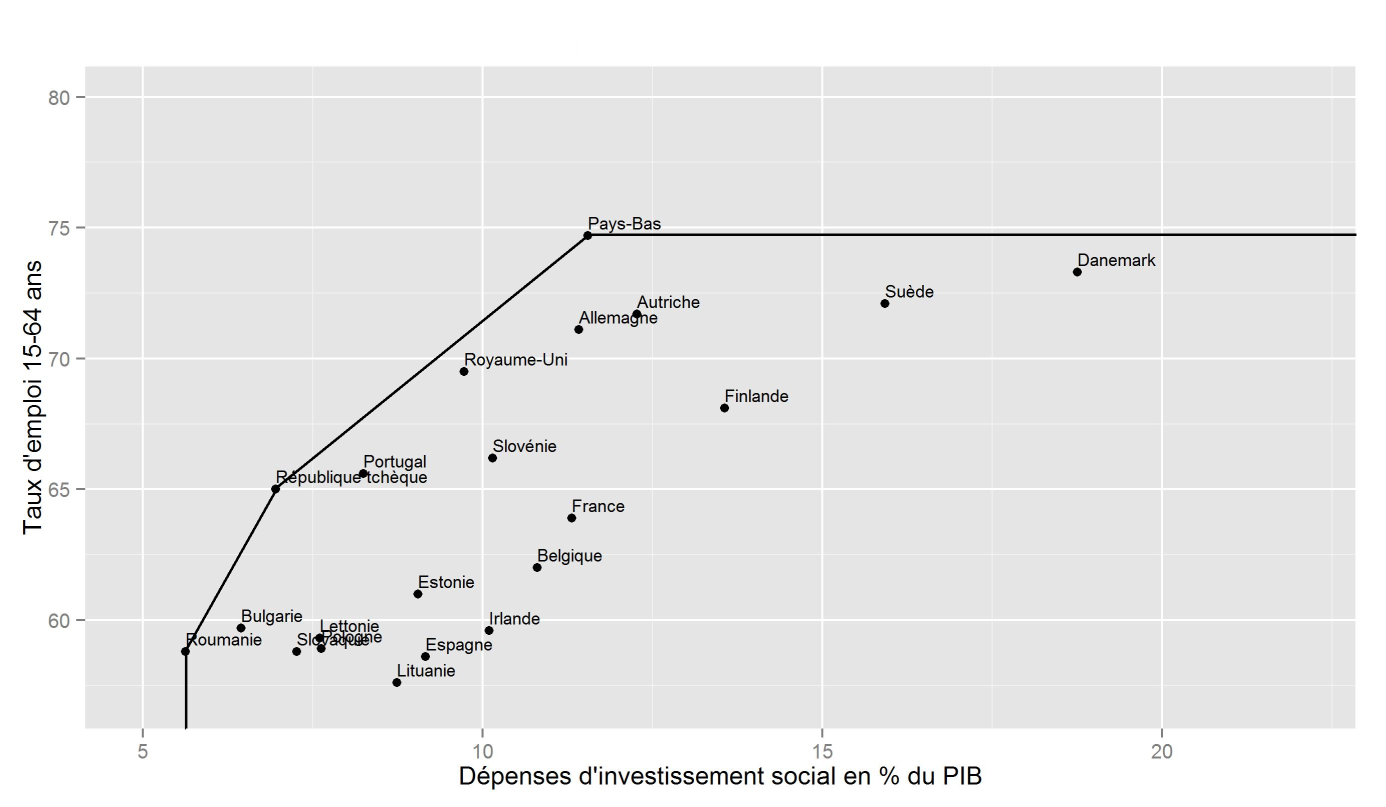
Note: This refers to 2009 for the United Kingdom
Source: Eurostat, Macrbond, BSI Economics, author’s calculations
Conclusion
We have just seen that social investment strategy is positively correlated with the employment rate of the general population. In other words, the higher a country’s level of social investment, the higher its employment rate should be. However, there does not appear to be a significant correlation between the level of social investment spending and the monetary poverty rate. The multiplicity of household income sources (employment income, investment income, benefits, etc.) undoubtedly limits the impact of social investment policies, which mainly affect employment income by promoting the return to work for all.
Thus, from the point of view of poverty reduction, social investment seems to have a limited impact, even if this impact undeniably exists. A social investment strategy is therefore justified if Member States set themselves the objective of increasing individual participation in the labor market. While this objective is laudable for various reasons, it should not be forgotten that some people will always have difficulty finding employment due, for example, to a severe disability or poor health. It is therefore necessary to continue to preserve the three functions of social protection simultaneously (social investment, social protection, and economic stabilization).
France has room for maneuver to move towards a social protection system that is more oriented towards social investment. Indeed, it appears to be inefficient in terms of the amounts spent on social investment and the results obtained. Conversely, the Netherlands is achieving particularly interesting results, which could serve as a possible avenue for reflection on the French situation.
The challenge now is to find a way to increase social investment spending without increasing social benefit spending. A shift from the current situation to a social investment strategy would require increasing social investment spending while keeping other social protection spending constant until social investment begins to have an impact in terms of increasing the employment rate. In a period of economic crisis and public deficit regulation, France cannot cope with such an increase in public spending. It must therefore find a path that allows it to move to a social protection system geared towards social investment while keeping spending levels constant. This is an ambitious challenge, but one that is essential in order to transition to a social investment strategy.
Notes
[1] Eurostat, table [lfsa_urgan]
[2] Eurostat, table [lfsa_ergan]
A long-term unemployed person is defined as anyone who has been unemployed for at least 12 months.
References
– De Deken J., 2012, « Identifying the skeleton of the social investment state: defining and measuring patterns of social policy change on the basis of expenditure data, » Paper to be presented at the ESPANET 2012 Conference Edinburgh, Scotland September 6-8, 2012
– European Commission, 2010, « EUROPE 2020: A strategy for smart, sustainable and inclusive growth, » COM(2010) 2020 final
– European Commission, 2013, « Towards Social Investment for Growth and Cohesion – Including implementing the European Social Fund 2014-2020, » COM(2013) 83 final
– Joumard I. et al. 2008, » Health Status Determinants: Lifestyle, Environment, Health Care Resources and Efficiency, » OECD Economics Department Working Papers, No. 627
– Kvist J, 2013, « The post-crisis European social model: developing or dismantling social investment? », Journal of International and Comparative Social Policy, vol. 29, pp.91-107
– Marguerit D, 2013, » Should we fear rising inequality? » , BSI Economics.
– Sutherland D. et al. 2007, » Performance Indicators for Public Spending Efficiency in Primary and Secondary Education, » OECD Economics Department Working Papers, No. 546