Summary:
· The conditions that enabled companies to restore their margins in 2015 will remain in place in 2016, which is a first positive sign for a sustainable return to investment.
· In 2015, a change in the cash flow trends of major French groups could signal a shift in their attitude, breaking with years of crisis and stagnant activity.
· However, high corporate debt levels could force companies in certain sectors to reduce their debt at the expense of investment.
· The presence of excess production capacity across all industrial sectors remains one of the most significant obstacles to hopes for a strong recovery in investment in 2016.
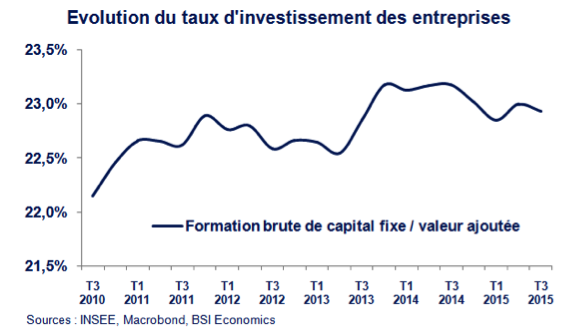
Business investment grew modestly in France in 2015, according to figures for the first three quarters (see chart below). The restoration of corporate margins appears to have contributed positively to this improvement in private investment. However, growth in gross fixed capital formation (GFCF) in 2015 will remain well below the average annual growth rate seen before the crisis (+4.8% on average between 2001 and 2007 and a forecast of +1% in 2015 according to INSEE surveys). The question then arises as to whether business investment will continue its momentum in 2016, thereby significantly boosting growth. Several factors suggest that we are currently witnessing a sustainable recovery in investment.
First positive point: the restoration of corporate margins
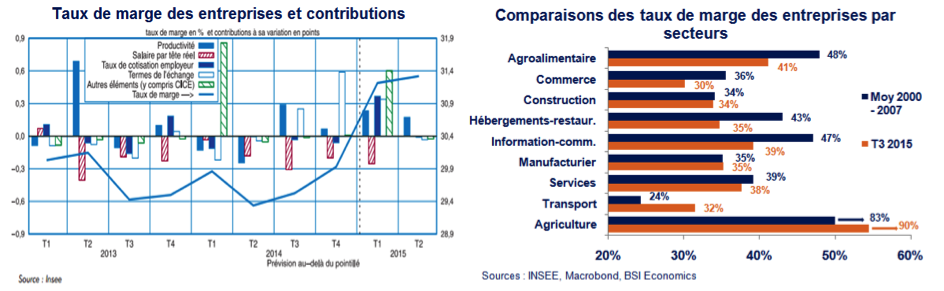
In 2015, we saw a sharp rise in corporate margins in France. In mid-2014, against a backdrop of deflationary risk, their margin rate[1] fell to 29.2% of value added. This was a record low compared with the 32.7% observed over the period 2000-2007. This rapid recovery in profit margins (+2 points since the second quarter of 2014, see graph on the left below) was made possible in particular by:
· The fall in oil prices, which enabled companies to reduce their energy bills, and the fall in raw material prices, which also contributed to lower production costs;
· The benefits of the CICE (Tax Credit for Competitiveness and Employment) launched by the government, which allows eligible companies to reduce their personnel costs. The CICE represents a tax credit of around 6% of a company’s total payroll, excluding salaries more than 2.5 times the minimum wage[2];
· And, to a lesser extent, the fall in the euro exchange rate for exporting companies, which has improved their cost competitiveness.
However, not all sectors have returned to their pre-crisis profit margins, as shown in the graph on the right below. The transport and agriculture sectors, which have benefited greatly from the fall in oil prices, are the only ones to have exceeded their pre-crisis levels, while others are close to doing so: manufacturing, construction and services.
Higher margins were a prerequisite for an improvement in investment figures, with higher profits for companies translating into better financial health. In 2016, government measures to support businesses will total nearly €33 billion (mainly divided between the CICE tax credit and the Responsibility Pact) and will continue to reduce the burden on businesses, giving them more leeway to invest, recruit, and promote innovation to boost productivity. At the same time, raw material and oil prices are expected to remain low enough to support margins again this year. The exchange rate effect, although more indirect than the previous factors, will be favorable to margin growth in 2016, with the European Central Bank’s (ECB) accommodative monetary policy under Quantitative Easing ( QE) expected to maintain downward pressure on the euro. The decline in sovereign bond yields initiated by QE should also feed through to all interest rates, thereby facilitating access to credit for businesses.
Second positive point: improved cash flow
At the end of the first half of 2015, the cash position of the 80 leading French groups[3] had already reached a historic high since 2009 (€162 billion, up 8% year-on-year), according to the Banque de France. An analysis of cash flows and their sources provides valuable insights into the financial health of companies and how they use their cash, which has been rising steadily since 2009.
There are three types of cash flow:
1. Those from operating activities, which are mainly related to the company’s core business and correspond to the difference between cash flow from operations and changes in operating working capital requirements (OWCR)[4];
2. Cash flow from financing activities, which relates to the distribution of dividends, the repayment of loans, and the issuance of shares.
3. Those originating from investment operations, which include the acquisition and disposal of tangible assets (such as capital goods), intangible assets, and financial assets, which are therefore directly related to the ability to increase production and productivity.
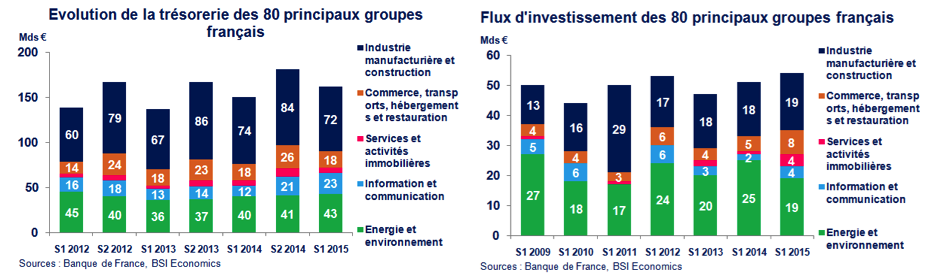
In 2015, a change in trend was observed compared to previous years: the first type of cash flow, related to operating activities, increased significantly, rising from €39 billion to €58 billion in one year, after four years of decline. Cash flow from operations[5], enabled in particular by the increase in the margin rate, increased while net cash flow from financing activities decreased. These figures are encouraging and prove to be a good indicator for estimating the recovery of companies.
Cash flow from financing activities remains high year-on-year (€30 billion in dividends paid in 2015, as in 2014). The third type of cash flow, related to investing activities, also increased, particularly through an increase in acquisitions of tangible and intangible assets rather than financial assets, which also marks a break with 2014. This increase demonstrates a certain willingness on the part of these companies to increase their production capacity and seems to break with the more wait-and-see attitude that characterized the crisis years.
First negative point: rising debt levels
Since 2009, however, the accumulation of cash by companies has not been accompanied by an increase in investment, for a number of reasons (poor economic conditions, weak private demand, deflationary risk, etc.). Another important reason is the rise in corporate debt. To improve their creditworthiness and obtain better financing terms, companies may therefore be encouraged to use their cash surpluses to reduce their debt, to the detriment of investment.
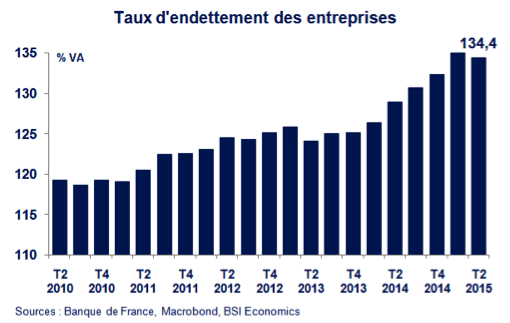
Although French companies are less indebted than their counterparts in other European countries (Italy, Spain, Ireland, and the Netherlands, for example), the current trend is clearly upward, as shown in the graph on the left above. The debt ratio[6] reached 134.4% of their value added (VA) in the second quarter of 2015. A tendency for companies to reduce their debt could therefore pose a threat to a sustained recovery in investment, particularly in a context of low interest rates. Indeed, temporarily reducing debt could prove to be a wise strategy in order to benefit from lower-cost debt refinancing. However, there is some heterogeneity between different sectors, with manufacturing and construction, for example, having low levels of debt.
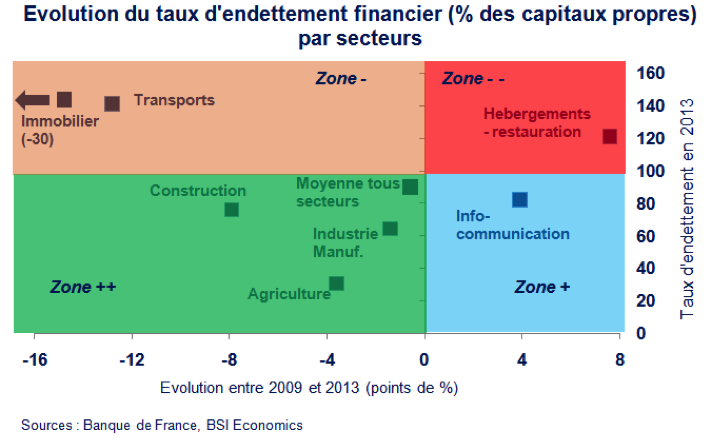
Furthermore, calculating private debt relative to value added is not necessarily the most appropriate approach, especially during periods of low economic activity, as value added tends to grow slowly, thereby increasing the debt ratio. When corporate debt is reduced to their equity capital, the level of debt falls significantly to around 80%, according to the latest available data. Thus, as shown in the graph above, some companies have already begun the process of deleveraging in the past. Sectors can be divided into four zones relative to the average for all sectors as a reference:
· Zone ++ in green: includes sectors with low debt-to-equity ratios (below average) that have already begun the process of deleveraging and may therefore be less inclined to reduce their debt: construction, agriculture, and manufacturing;
· Zone + in blue: includes sectors with a low level of debt to equity but whose debt stock has increased in recent years, which could reduce their ability to invest to a lesser extent: information and communication.
· The orange zone: includes sectors that tend to reduce their debt but whose debt stock remains very high, which could force them to continue down this path rather than invest: real estate and transportation.
· The red zone: includes sectors whose debt levels are well above average, with a certain increase in recent years, and which could have a significant propensity to reduce their debt: accommodation and food services.
Second negative point: persistent overcapacity
While debt could be a potential obstacle, constraining companies from investing, the capacity utilization rate[7] (CUR) seems to be a fairly effective indicator of whether companies will be more willing to invest in 2016. The difference between the average CAP in 2015 and the average for the pre-crisis period 2000-2007 shows which sectors have unused production capacity, i.e., overcapacity. In the presence of overcapacity, if demand is strong, companies will be able to adjust their supply without necessarily needing to invest, as they will already have internal production capacity that they have not used until now. A negative gap between the 2015 TUC and the pre-crisis TUC would therefore suggest that these sectors would not need to invest in 2016.
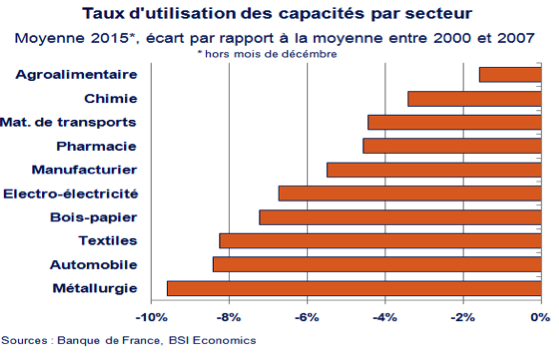
The graph above shows that in 2015, all industrial sectors recorded a negative gap, indicating overcapacity. Although some sectors, such as agri-food and, to a lesser extent, chemicals, appear to be approaching their pre-crisis TUC levels, most sectors still show a significant gap, particularly in metallurgy, automotive, and textiles.
Compared to the period of crisis and stagnation between 2008 and 2014, several sectors (transport equipment and automotive) have significantly improved their TUC levels, suggesting a positive dynamic that could lead to a potential recovery in investment in these sectors if demand increases. Agri-food and chemicals are the only two sectors whose TUC shows a small gap compared to their pre-crisis TUC, while performing much better than in the period 2008-2014.
However, other sectors (wood and paper, pharmaceuticals, and textiles) had even greater overcapacity in 2015 than during the period 2008–2014. The electronics and electricity sectors, as well as metallurgy, have significant overcapacity compared to both the pre-crisis period and the crisis period between 2008 and 2014.
Conclusion
Not all indicators are necessarily green, but there are several reasons to believe that private investment in France will make a lasting comeback in 2016. The restoration of margins and improved cash flow should support a sustained return to investment, particularly in the transport and construction sectors. However, rising debt levels coupled with persistent production overcapacity could weigh on or even slow down this recovery. Strong private consumption will also be needed to support an increase in investment and fully revive economic activity.

Bibliography:
Banque de France, » The financial situation of the main French groups in the first half of 2015: declining profitability but a financial strategy that prepares for the future , » Business Directorate – Business Observatory, December 2015.
BSI Economics, » Investment: a relapse?« , Clément Bouillet, February 2015.
Coe-Rexecode, » France: cash flow survey of large companies and mid-sized companies , » November 2015.
Coface, » What should we fear from ‘low-flation’? » Panorama of the Economic Research Department, December 2014.
France Stratégie, » Monitoring Committee for the Tax Credit for Competitiveness and Employment: 2015 Report, » September 2015.
INSEE, « A little fuel for consumption and margins , » Economic Note, March 2015.
Notes:
[2]In 2016, the minimum wage is €1,466.67 gross per month, so 2.5 times the minimum wage is €3,666.67 per month.
[3]« The 80 leading French industrial and commercial companies listed on Euronext Paris’s Compartment A » include companies from the manufacturing, construction, trade, transport, information and communication, accommodation and catering, services and real estate, and energy and environment sectors. The study of these companies, covering a large number of sectors, serves here as a « barometer » for assessing cash flows and their use.
[4]BFRE is calculated as the sum of inventory accounts and accounts receivable/payable, less accounts receivable/payable and tax and social security liabilities.
[5]The self-financing rate of companies, which in national accounts corresponds to the ratio of savings to gross fixed capital formation, rose from 79.6% at the end of 2014 to 88.3% in Q3 2015.
[6]In national accounts, the debt ratio corresponds to the ratio of total debt to value added.
[7]The capacity utilization rate is the ratio of production capacity (machinery and equipment) used in the production process to total potential production capacity on a given date. A capacity utilization rate above 80% is generally conducive to increased investment. Currently, only the pharmaceutical sector is in this situation, with all other sectors below the 80% threshold.