Abstract :
· After a decline between 2003 and 2012, the latest PISA report highlights that academic standards in France stabilized between 2012 and 2015.
· France’s academic results are in line with the OECD average, and the French education system is marked by significant socioeconomic inequalities that undermine its effectiveness.
· In terms of possible areas for improvement, the development of an incentive system for teachers in disadvantaged schools could help to combat educational inequalities.
· It is also important to understand students’ needs in order to offer them tailored, personalized education. Reforming teacher training and monitoring their development could also help improve academic results in France.


With the presidential election just a few months away, the latest results of the international PISA survey raise questions about the state of the education system in France. The PISA (Programme for International Student Assessment) survey, developed by the OECD, seeks to assess the skills of 15-year-old students. Seventy-two countries and economies participated in the 2015 wave, enabling a comparative analysis to be carried out. The tests in this survey cover science, mathematics, and reading. The 2015 wave focuses on science. The PISA survey is conducted every three years, which also allows for a dynamic analysis of changes in students’ knowledge. The aim of this article is to see what we can learn from the results of this survey, particularly those from the latest wave.
France ranks in the OECD average but is marked by significant socioeconomic inequalities
At first glance, France ranks in the OECD average in mathematics, reading, and science (Figure 1). The countries with the best performance are Singapore, Hong Kong, Japan, Canada, and Finland. Compared to the previous wave, which took place in 2012, France’s level is identical in science, has increased slightly (2-point increase) in reading, and has decreased in mathematics (2-point decrease). After a worrying decline between 2003 and 2012, academic results in France have not deteriorated significantly, contrary to what many observers had predicted.
Figure 1: Results of the 2015 PISA survey
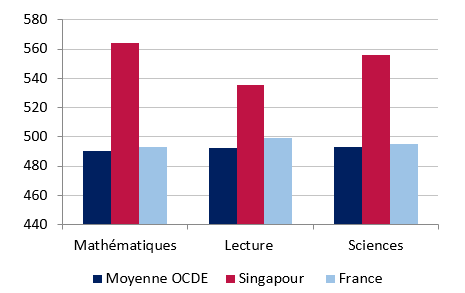
Sources: Author, PISA 2015, BSI Economics
However, this general observation masks significant socio-economic inequalities in France. While the French school system manages to educate a small elite, it is characterized by greater inequalities than in most other OECD countries.
According to the OECD, 20% of the differences in science performance between students can be explained by their socioeconomic status, compared with only 13% for the OECD average.[1] The performance gap between the most disadvantaged children (bottom quartile of socioeconomic status) and the most advantaged children (top quartile) in France is one of the widest among all OECD countries (only Luxembourg has a wider gap) (Figure 2). Inequalities in education are therefore particularly marked in France, where there is a high degree of social determinism. The OECD points out that nearly 40% of children from disadvantaged backgrounds are struggling at school in France, compared with 34% for the OECD average. The countries with the best results are characterized by less social determinism. In Japan, for example, only 10% of differences in science performance can be explained by students’ socioeconomic status.
Figure 2: Performance gap according to an individual’s socioeconomic status
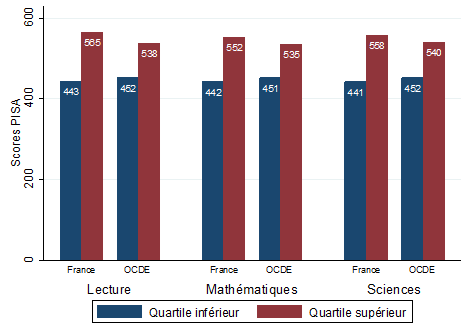
Sources: Author, PISA 2015 BSI Economics
The latest PISA report also highlights that, in France, students from immigrant backgrounds are particularly likely to experience academic difficulties. Forty percent of children from immigrant backgrounds are in difficulty, compared with only 18% of other students.
In terms of absenteeism, France ranks fairly well, with 11% of students missing a day of school without permission, compared to an average of 20% for OECD countries. However, once again, there are significant disparities between students. For example, 21% of students from disadvantaged backgrounds reported being absent, compared to 6% of students from privileged backgrounds. These disparities may be one of the factors explaining the differences in performance according to socioeconomic status. Another distinctive feature of France is that repeating a year remains a common practice, with 22% of students having repeated at least once (11% for the OECD average).
In science, French students, especially girls, are less attracted to scientific subjects than the OECD average. This may be explained by the fact that in France, few girls consider working in a scientific field (less than one in five, compared to one in four boys). In this area, France is once again well below the OECD average.
The learning environment is one of the factors that can influence academic performance. In this respect, France is in a fairly good position. Less than 30% of students attend schools where there is a noticeable lack of equipment. Furthermore, only 20% attend schools that lack teaching materials. This is below the OECD average. French schools are therefore fairly well equipped in terms of materials, and there are no differences based on the child’s socioeconomic status.
What lessons can be learned from the PISA champions?
The PISA report does not just make observations, it also proposes policies to be implemented to improve the quality of education in countries facing difficulties. In France, the main challenge is to tackle educational inequalities. Our education system must enable all children to progress, regardless of their background. For a policy to combat educational inequality to have an impact, it is important to tackle this problem from an early age. In this regard, the Framework and Planning Law for the Reform of the French School System (July 2013) is a step in the right direction, as it seeks to combat school failure from an early age.
One initial avenue for consideration is to ensure that disadvantaged schools receive the material and human resources necessary to help children in difficulty. It is not just a question of providing additional resources, but also of ensuring that these resources are used wisely. For example, the Pupil Premium program, introduced in England in 2011, provides additional funding to schools attended by students from disadvantaged backgrounds. In return, schools must demonstrate that disadvantaged students are making progress.
Reducing inequality will also inevitably involve teachers: experienced, motivated teachers must be encouraged to teach in these schools. These incentives could also help to enhance the status of the teaching profession. For example, South Korea has introduced a system of incentives based on additional income, smaller classes, and reduced teaching hours to attract teachers to schools in disadvantaged areas. This policy seems to be bearing fruit, as students from disadvantaged backgrounds are more likely to have a teacher with at least three years of experience than students from privileged backgrounds. The report also highlights the importance of monitoring children from disadvantaged backgrounds and offering them more personalized education. This begins with an assessment of needs and the quality of available education. In this area, France appears to be lagging behind. Only 23% of French students attend a school where they are asked for feedback on the teaching they receive, compared to 69% for the OECD average.
A first, inexpensive step would therefore be to make these practices standard. Once needs are known, it is easier to offer personalized education. In Finland, for example, one of the potential reasons for the success of the education system is that all students are entitled to personalized support throughout their studies. Offering personalized and adapted education for all can be achieved through a tutoring system. In France, only 33% of students report receiving tutoring at their school, compared to an average of 70% in OECD countries, which leaves considerable room for improvement.
To be effective, any educational reform must be supported by the teaching profession. It is the teachers who will decide whether or not to implement the reforms. There are several ways to improve the quality of teachers. First, it is essential to review the recruitment of teachers in France. Many countries with high-performing education systems, such as Finland and Japan, have opted for a more selective teacher recruitment policy than France. There is also room for improvement in terms of training. The 2013 TALIS survey highlighted that teachers in France felt less well prepared in terms of teaching methods and participated less often in continuing education than in many other countries, particularly those with good PISA test results. In Japan, for example, teachers must undergo mandatory continuing education and benefit from a mentoring system from their first year on the job. In addition, since 2009, they have been required to renew their certification every ten years by demonstrating that they still possess the necessary skills to be a teacher. Another example is Singapore, where teachers are evaluated annually and the best performers are awarded a bonus. It is therefore essential to improve teacher training so that they are able to use the most effective teaching tools.
Conclusion
School results in France are therefore very mixed. Although the decline observed until 2012 has stopped, French students are only average among OECD countries. They are far behind Singapore, Hong Kong, and Japan. In addition, children from disadvantaged backgrounds perform significantly worse than those from privileged backgrounds.
France is in fact one of the OECD countries where social determinism plays one of the most important roles in academic success. This is by no means a fatalistic view; there is room for maneuver to improve the French education system, but it is imperative to explore these avenues of reflection in order to implement effective reforms.
[1]This percentage represents the percentage of variance in science test scores that can be explained by the student’s socioeconomic status. This status is represented by an index that synthesizes the parents’ education, their professional status, the family’s assets, the number of books, and the educational resources available at home.