Summary:
– The crisis entailed a dramatic widening of the market income distribution. All income groups were hit, but the bottom and middle ones suffered stronger and more persistent losses.
– The tax and transfer system was crucial at taming the rise in inequality, with cash transfers being the most important instrument.
– The system did not, however, fully cushion the negative distributional impacts of the crisis, with disposable income inequality exhibiting an increase.
– The redistributive action of the system was marked by two phases: 2008-2009, when it was reinforced; 2010-2012 when it was weakened, despite remaining at high levels.

Macroeconomic shocks such as the recent global economic crisis can have far-reaching effects on the distribution of resources at both the individual and household levels (Krueger et al. (2010), Heathcote, Perri and Violante (2010a and 2010b)). The possibility that these distributional effects may in turn have non-negligible implications for the recovery of the aggregate economy from the crisis has recently gained attention (Stiglitz (2013), Cynamon and Fazzari (2014)). If a crisis-led surge in distributional imbalances can feedback into an anemic behaviour of economic activity, then redistributive policies, aimed at promoting a stabilisation of the income distribution, may also have an important macro-stabilisation role. In this case, a thorough assessment of the dynamics of the income distribution following a crisis and the relevance of strong redistributive policies is crucial for the design of well-informed crisis-response policies.
This column discusses empirical evidence on one important case study: the 2007-2008 crisis in the US. It draws on data from the March supplement of the Current Population Survey (CPS), for the period between 2007 and 2012 [1].
Impact of the crisis on the market income distribution
The “pure” distributional impacts of the crisis, prior to any redistribution done by the government, may be studied by looking at the evolution of a summary measure of market income inequality. Market income corresponds to all pre-government income, i.e. the income that individuals receive from their labor earnings, private transfers and financial income, before obtaining any transfers from the government or paying any taxes. A popular measure used to summarize how unequal an income distribution is the Gini index.
Figure 1 shows both the level and the percentage cumulative change of the Gini for market income, between 2007 and 2012. The figure undoubtedly shows that market income inequality experienced an increase in the aftermath of the 2007-2008 crisis, of approximately 6% between 2007 and 2012. Most of this increase occurred between 2007 and 2010, comprising the so-called recession years. After 2010, the so-called recovery years, the yearly growth rate of inequality was considerably smaller, being even negative in 2012. However, these decreases were very modest when compared to the growth that had occurred in the preceding years, implying that in 2012 market income inequality was still considerably higher than in 2007.
Figure 1: Market income inequality
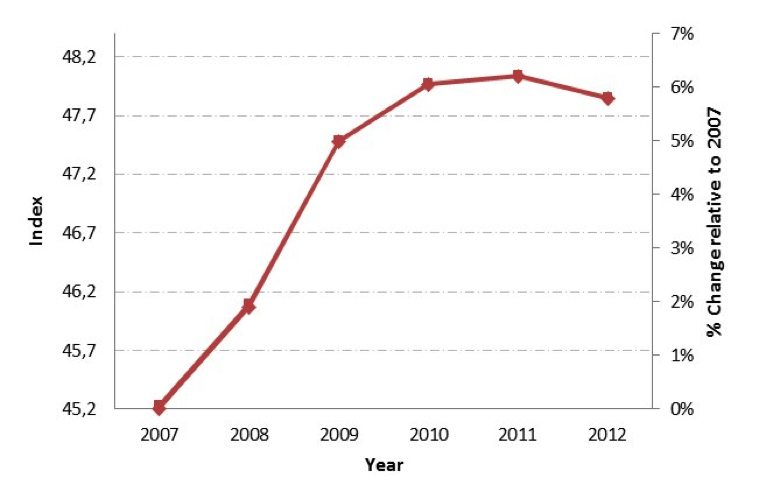
Sources: Almeida (2015), BSI Economics
Summary measures like the Gini, although useful to get an overall picture of the evolution of income inequality, do not allow for a deep understanding of movements inside the income distribution. This can be obtained by looking in detail at the evolution of income at specific sections of the distribution (for e.g. percentiles if we consider 100 sections) or of average income for different income groups, with each income group corresponding to a group of percentiles[2]. Figure 2 shows the cumulative percentage change between 2007 and 2012 of average market income for six income groups: bottom 10, 20 and 50, and top 50, 20 and 10. The graph starkly illustrates a widening of the market income distribution over the 2007-2012 period, with bottom income groups losing a higher percentage of their income than higher income groups. By 2012, individuals in the bottom 20, for example, had an average income 40% lower than individuals in that same group had in 2007. In contrast, individuals in the top 20 income group experienced very modest losses, of approximately 5%. Furthermore, consistently with the evidence from the Gini, it can be seen that the bulk of the losses for all groups occurred between 2007 and 2010, with 2011 and 2012 bringing a stabilization or even a slight improvement of their market income situation.
Figure 2: Average market income by income group
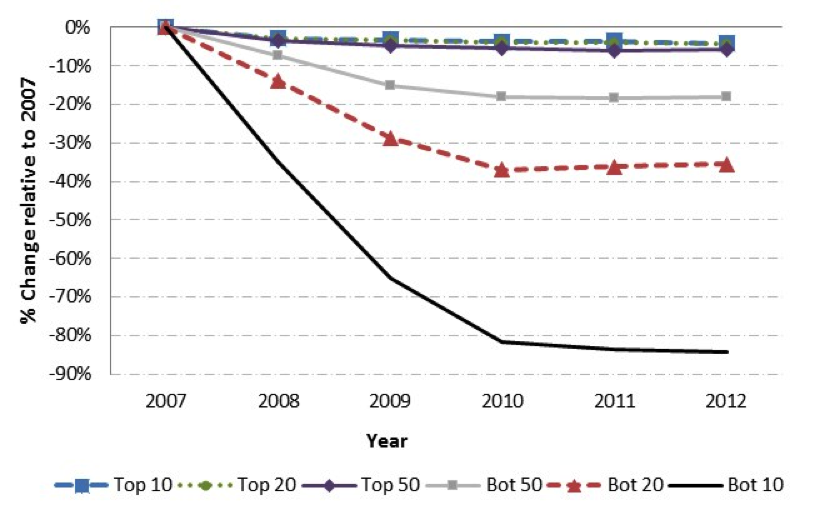
Sources: Almeida (2015), BSI Economics
The above described evolution of market income inequality was completely driven by the behavior of labor earnings (private transfers and financial income actually contributed to a reduction in inequality). This largely reflected developments in employment, with employment losses and decreases in the number of hours worked being much more pronounced for the lower parts of the income distribution.
The cushioning effect of the tax and transfer system
Redistribution by the government is typically a key way of mitigating (or cushioning) increases in market income inequality. It is essentially achieved through the tax and transfer system, which benefits more lower to middle income households by providing them with relatively more transfers and charging them relatively less taxes. It is typically composed of four main types of elements:
· cash-transfers, which include all pre-tax income provided by the government;
· taxes, which include all personal income taxes levied by the government;
· tax credits, which constitute rebates to the amount of tax liabilities;
· and in-kind transfers, which are transfers given or paid by the government in goods, commodities or services, instead of cash.
To assess the overall redistributive action of the tax and transfer system, one typically looks at differences between market and disposable income inequality, with disposable income being the income obtained after adding all transfers and tax credits and deducting all personal income taxes from market income.
Figure 3 compares the growth in market income inequality (already presented in Figure 1) with the growth in disposable income inequality, measured using the Gini index. It can be clearly seen that following the crisis disposable income inequality rose by much less than market income inequality. In fact, between 2008 and 2009, disposable income inequality did not even increase, meaning that redistribution was able to completely offset the “pure” overall distributional impact of the crisis. From 2010 onwards, however, this changed such that by 2012 disposable income inequality was also higher, by approximately 3%. This points to an expressive but only partial role of the tax and transfer system in cushioning the negative distributional impacts of the crisis.
Although a causal analysis cannot be drawn in the context of this column, it is clear that these developments coincided with two different stages in the setting of tax and transfer policies. In a first stage, between 2008 and 2009, these policies were strongly reinforced, mostly through: increases in the amounts of cash and in-kind transfers; enlargement of the eligibility criteria to be covered by the social safety net; extension of existing tax credits and introduction of new ones[3]. In a second stage, from 2010 onwards, although these policies remained strong, they were gradually phased out with some of the previously introduced measures being downsized or eliminated. In addition to the effects of discretionary policies just discussed, “mechanical” changes induced by automatic stabilizers are also likely to have played a role. Indeed, for each individual, changes in tax burdens and benefit entitlements result not only from policy action but also from the evolution of its market income. Since income taxes depend on pre-tax income levels, lower pre-tax income will reduce the amount of taxes to be paid, even if the rates stay the same. Likewise, means-tested benefits will typically increase if an individual’s pre-benefit income decreases. In a crisis period, when a large part of the population experiences income losses, it is therefore natural to have an automatic increase in the amount of transfers given by the government and an automatic decrease in the amount of taxes paid by households. The opposite is true for recovery periods.
Figure 3: Market and disposable income inequality
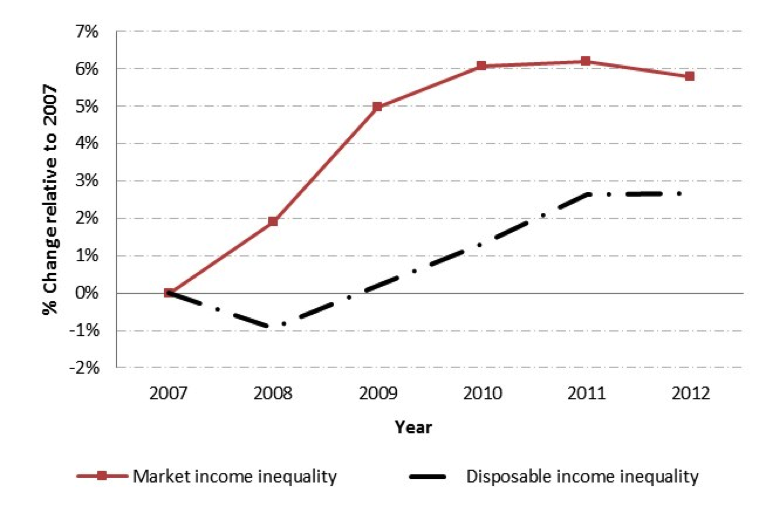
Sources: Almeida (2015), BSI Economics
To better qualify the above described evolution, Figure 4 provides the change in average disposable income by income group, for the same six income groups as in Figure 2. Comparing the two graphs, it is clear that for all groups the percentage loss in disposable income was much smaller than in market income. This was particularly true for bottom income groups, for whom the difference is especially large. Furthermore, two different moments can be identified, in line with what has already been previously discussed. Between 2008 and 2009, the percentage losses of lower income groups were actually smaller than the ones of higher income groups. From 2010 onwards, however, the situation reversed and a widening of the disposable income distribution occurred, just like in the case of market income. This corroborates the finding that the action of the redistributive system, although expressive, was only partial.
Figure 4: Average disposable income by income group

Sources: Almeida (2015), BSI Economics
Besides assessing the overall redistributive action of the tax and transfer system, it is interesting and useful to grasp the contribution made by each type of mechanism. To obtain this, one can: (1) compute a measure of overall redistribution equal to the absolute difference between the Gini for market income and the Gini for disposable income; (2) decompose this difference into the contribution provided by each element of the tax and transfer system, by sequentially computing the difference of the Gini between measures of income without and with the element in question[4]. The levels and annual changes of these quantities are given in Figure 5. The figure shows that overall redistribution amounted to an average of 13 Gini points over the post-crisis period, which represented approximately 27% of market income inequality. On average, cash-transfers were the instrument that played the largest role, accounting for 50% of overall redistribution; they were followed by taxes (35%), tax-credits (10%) and in-kind transfers (5%).
Figure 5: Gini-based redistributionmeasures
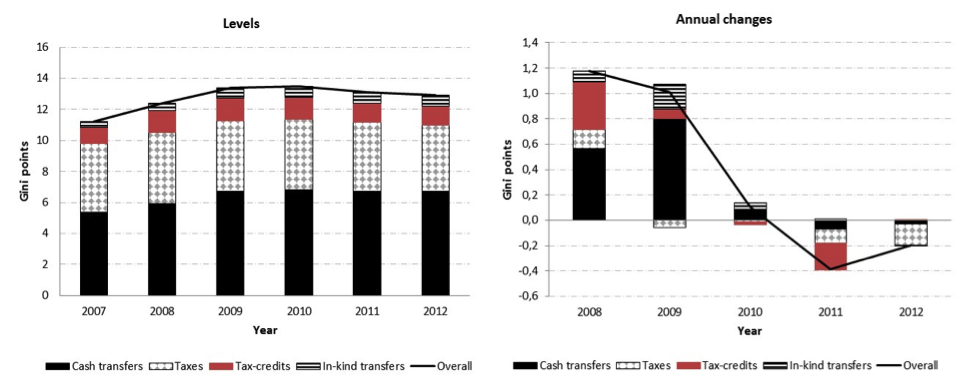
Sources: Almeida (2015), BSI Economics
Furthermore, as noted before, redistribution increased substantially over the post-crisis period, with an overall increase of 1.71 points, such that it was 15% higher in 2012 than in 2007. The two-phase evolution previously discussed can again be seen: the first two years of the post-crisis period, were marked by an expressive increase in redistribution, which completely cushioned the significant increase in market income inequality observed in this period; the following years brought about a stagnation or even decrease in redistribution. When considering the whole period, cash-transfers were clearly the most important contributor to the positive change in redistribution, accounting for 1.35 points of the overall increase of 1.71 points. This greatly reflected a significant extension of unemployment benefits, in the context of the Emergency Unemployment Compensation program introduced in 2008, as well as an expressive rise in the number of unemployed people. Social security and retirement benefits also exhibited prominent increases, following an acceleration in the number of exits from the labor force into retirement. In-kind transfers and tax-credits also contributed positively although to a much smaller extent, with a change of 0.35 and 0.21 points, respectively. The positive contribution of tax credits largely reflects the significant tax rebates introduced by the Economic Stimulus Act of 2008 and the American Recovery and Reinvestment Act (ARRA) of 2009. In the case of in-kind transfers, the positive evolution is mostly due to the expansion of food assistance programs provided by the Food, Conservation and Energy Act of 2008 and by the ARRA. Taxes, however, contributed negatively, exhibiting a redistributive effect 0.19 points lower in 2012 than in 2007. Although there was an overall decrease in the tax burden, this did not particularly favor poorer households and, on the contrary, favored relatively more middle to high income households. This is likely to have been particularly true for the one-year reduction in the FICA tax (social security contribution) introduced by the Middle Class Tax Relief Act in 2011, which benefited mostly employed people excluding all people who were unemployed or not in the labor force.
Conclusion
This column has argued that the crisis did nothing to stem the tide of rising inequality that was being observed before the crisis in the US and, on the contrary, it accentuated it. Dramatic and persistent losses in the lower parts of the market income distribution occurred, contrasting with weaker and more transitory losses in the upper parts. The tax and transfer system strongly reacted in the immediate aftermath of the crisis (2008-2009), managing to tame a rise in disposable income inequality. From 2010 onwards, however, although the system remained strong, a gradual weakening of its redistributive power was observed. Five years after the start of the crisis, the upper part of the income distribution had managed to almost fully recover from its losses, while the bottom and middle parts were still experiencing significant ones.
These findings show that aggregate shocks, such as the 2007-2008 crisis, may have substantial heterogeneous impacts across income groups. Furthermore, they shed light on the role of tax and transfer policies as countercyclical tools to offset market income declines following a crisis. They therefore raise awareness for the need of considering inequality and redistribution issues when designing policies aimed at coping with aggregate shocks.
References
Almeida, Vanda (2015), “Inequality and redistribution in the aftermath of the 2007-2008 crisis: the US case”, Available at: http://papers.ssrn.com/sol3/papers.cfm?abstract_id=2670586
Cynamon, Barry, and Fazzari, Steven (2014), “Inequality, the Great Recession, and slow recovery”, Available at: http://papers.ssrn.com/sol3/papers.cfm?abstract_id=2205524
Krueger, Dirk et al. (2010), “Cross sectional facts for macroeconomists”, Review of Economic Dynamics, Vol. 13, issue 1, Available at
Heathcote, Jonathan and Perri, Fabrizio and Violante, Gianluca (2010a), “Inequality in times of crisis: lessons from the past and a first look at the current recession”, VOX, 2 February 2010
Heathcote, Jonathan and Perri, Fabrizio and Violante, Gianluca (2010b), “Unequal we stand: an empirical analysis of economic inequality in the United States, 1967-2006”, Review of Economic Dynamics, Vol. 13, issue 1,
Stiglitz, Joseph (2013), “Inequality is holding back the recovery”, New York Times, January 19
Notes
[1] This column is based on Almeida (2015), where a much more developed and complete analysis of the issues discussed here can be found.
[2] For example, the group “bottom 10%” corresponds to all people whose income is below or equal to the 10th percentile of the distribution. Similarly, the group “top 10%” includes all people whose income is above the 90th percentile of the distribution. Average income for each of these groups is obtained as the average of the income received by all individuals belonging to the group. In practice, it is less straightforward than what is described here, as several adjustments need to be done to income before a meaningful average can be computed. Please see Almeida (2015) for details.
[3] A detailed description of the main changes to the US tax and transfer system following the crisis, together with a quantitative analysis of the evolution of each mechanism, is given in Almeida (2015).
[4] For a detailed explanation of this procedure please refer to Almeida (2015).