Understanding the motivations behind international waste trade flows and being able to characterize them is essential to comprehending the circular economy model in its international dimension and identifying the risks this trade poses tothe environment and populations.
Abstract :
- Waste has a value that can be positive or negative. This value depends on its treatment costs and the revenue generated by its recovery, if recovery is possible. To optimize this value, economic agents can trade their waste on the global market: for example, by exporting to countries where treatment costs are lower and demand is higher (higher selling price).
- Waste is the subject of cross-border trade, which is growing steadily in volume and rapidly in value.
- In general, importing recyclable waste allows for the recovery of low-cost raw materials, which can be directly reintroduced into the national production process.
- The fact that a large proportion of waste exports are sent from developed to developing countries can pose health and environmental risks if populations treat hazardous or contaminated waste with inappropriate technology.
- North-North flows, on the other hand, tend to be the result of industrial specialization strategies or energy needs (imports for incineration with energy production).
- The lack of information on these flows, many of which are illegal, prevents us from characterizing them with certainty.
The fact that waste can have value is counterintuitive, since by definition, like any other good, waste is intended to be discarded by its owner, who therefore wants to get rid of it. However, if certain types of waste can be sold at a positive price, it is because they contain value.
In 2016 in France, for example, a ton of mixed cardboard and paper waste sold for around €75 (Copacel, 2016). Once processed, this ton can fetch a price of nearly €200 (Famae, 2017). This ton of recycled paper is traded across borders, mainly to China, and optimizes transport by filling the containers of ships returning to Chinese ports, which used to return empty (Usine Nouvelle, 2011). There is also commercial activity at a lower level in the value chain: before the recycling of paper/cardboard, i.e., the marketing of waste.
In this article, we first look at the value of waste, which drives international trade. We then characterize this trade.
Waste has a value that can be positive or negative. Understanding the determinants of this value helps us to understand the motivations behind the trade in this waste.
The value of waste is positive when the (anticipated) cost of treating the waste is lower than the (anticipated) revenue from its recovery (Bernard et al., 2012). Recovery can be material (mainly recycling and reuse) or energy-based (incineration with energy recovery). If waste recovery is impossible or very costly, then the value of the waste will be negative. Waste that cannot be recovered is disposed of by incineration (without energy recovery) or landfill. The value of waste therefore varies according to these two components.
Potential value of waste = (monetary revenue from recovery) – (treatment costs)
Monetary revenue from recovery
Material recovery allows the material in the waste to be recovered (recycling) or reused in the same way as its first use (reuse) or in a different way (repurposing). When this material is recovered through recycling, it is referred to as secondary raw material (SRM), as opposed to virgin raw material (VRM). The closer the secondary material is to the virgin raw material in terms of technical characteristics (efficient recycling technology), the more the prices of SRM and VRM will correlate, as the raw material can increasingly be substituted by secondary (recycled) material. The technology currently has its limitations, as recyclable materials, such as plastic bottles, can lose up to 75% of their value after their first use (The Guardian, 2015). This loss of value may explain why the recycling model can be described as unprofitable and why « profit-maximizing » economic agents are turning to other solutions. When virgin raw materials become scarce in relation to demand, the potential value of waste increases through a substitution effect.
Waste also has an energy potential value (the amount of energy that can be recovered per kg of incinerated waste). In recent decades, waste incineration with energy recovery has become increasingly widespread, particularly for plastics, which have a particularly high energy potential[1]. Market conditions in the energy sector therefore contribute to determining the value of waste.
Waste treatment cost
The cost of recovery decreases with technological advances (cost efficiency and MPS increasingly similar to MPV). For waste that cannot be recovered or is difficult to recover, the potential value of the waste will be negative and depend almost entirely on costs (as there is no revenue). These treatment costs will be strongly influenced by the regulations and taxation in force on waste management. The more demanding the environmental regulations, the higher the treatment costs will be. This argument is of course only valid in the short term, because in theory, in the long term, companies adapt by adopting more environmentally friendly behaviors and technologies.
The potential value of waste will be central to decisions on whether to export or import waste. To optimize the potential value of their waste, agents may decide to export and sell waste to countries where treatment costs are lower (cheaper labor, more efficient technology, or more lax regulations) and demand is higher (e.g., China, where demand for PM is very high). Conversely, the global economy and trade have a strong influence on the potential value of waste, through the effect of global demand and the price of raw and secondary materials.
Economic agents will seek to optimize the potential value of their waste through international trade. This strategy can have harmful effects on the environment.
Characteristics of international trade in waste: changes in volume and value, and major players.
International trade in waste is growing steadily and sustainably in volume (an average of +6.7% per year over the period 2003-2010) and rapidly in value (+23% per year over the same period, with a sharp dip in 2009; Bernard et al., 2012). This decoupling is due to the increase in the price of raw materials, for which waste intended for recycling/recovery is a perfect or imperfect substitute (Bernard et al., 2012). In 2010, waste accounted for 0.9% of global trade (bis).
In practice, international trade in waste mainly concerns waste intended for recycling or reuse (Bernard et al., 2012; Kellenberg, 2012). Scrap metal is the main material traded, accounting for 43% of trade by volume (2010 value; Bernard et al., 2012). These materials are attractive from an economic point of view due to the high intrinsic value of the material itself and its high recyclability. Exporting waste for incineration or landfill is much rarer because it is discouraged or prohibited in many countries (Bernard et al., 2012). However, cases of illegal exports remain very common (Bernard, 2009; Dato, 2017; Tojo et al., 2008).
Table 1: Main importers and exporters of waste (2010)
Source: Bernard et al. (2012); Table III, p. 108.
China and the United States are the two main players in the global waste trade, as importer and exporter respectively (Table 1). China imports large quantities of waste paper and cardboard from the United States to produce packaging for its manufacturing industry (Bernard et al., 2012; Map 1), in addition to paper and cardboard that has already been recycled.
Map 1: International trade in unbleached kraft paper or cardboard waste or corrugated paper/cardboard (2016)
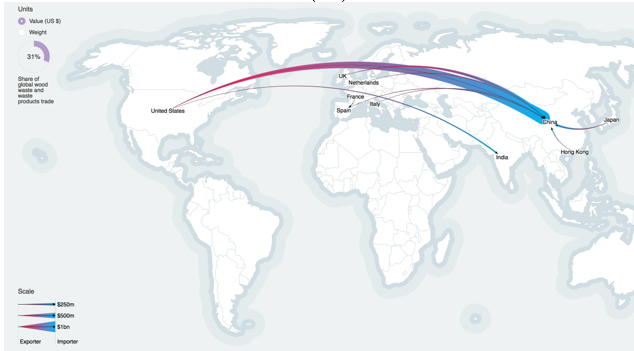
Source: Resourcetrade.earth (Chatham House); UN Comtrade data visualization tool
Trade between the US and China shown on Map 1 in 2016 amounted to $1.2 billion (7 million tons in volume).
However, the figures presented in this sub-section only reflect declared exports of waste, whereas many exports are carried out illegally, either by falsifying customs declaration documents or by not declaring them at all. A striking example of illegal exports is the trade in electronic waste (hazardous waste) to African countries (Bernard, 2009; Dato, 2017). A report by the European Environment Agency (EEA, 2009) shows that illegal trade in waste increased between 2001 (25 Kt of waste) and 2005 (47 Kt). However, their figures are based only on the shipments they were able to intercept, and therefore represent a minimum indicator of the actual illegal trade.
North-South flows: the « waste haven » hypothesis?
While North-South flows account for 16% of trade in goods, this figure rises to 25% for waste (Bernard et al., 2012). This much higher proportion is thought to be the result of a cost optimization strategy: low recycling and labor costs and more lax health and environmental regulations in Southern countries. For example, recycling a computer costs $2 in China compared to $30 in the United States (Bernard, 2011).
The advantage for these importing countries is that they can recover materials at low cost, which they can then directly reintroduce into their production processes (Bernard, 2011), or import second-hand equipment at very advantageous prices. According to a study by the BAN association (2015), the information technology sector has grown significantly in Africa through imports of second-hand equipment, but at the cost of enormous environmental and health damage. Southern countries are sometimes even more reluctant to regulate this market, as it allows disadvantaged populations to make a living from informal recycling activities.
Environmental and health safety issues arise particularly in the case of hazardous waste, but also for non-hazardous solid waste that is poorly sorted and contaminated with heavy metals or even radioactive materials (The Economist, 2017; Kellenberg, 2012). Numerous cases of contaminated waste have recently led China to drastically restrict its imports of waste, which has disrupted the global waste market.
Electrical and electronic equipment is mainly shipped illegally to countries in the South, as this North-South flow is prohibited by the Basel and Bamako conventions (for African countries). It enters commercial channels as second-hand goods. Even when inspections are carried out, it is very difficult for the authorities to distinguish between reusable and non-reusable products (Tojo et al, 2008). In Lagos (Nigeria), a study by BAN (2005) found that 75% of imported electronic waste is irreparable/non-reusable. The health problems that have emerged over the last decade have led some African states to adopt the Bamako Convention (1998), which prohibits the import of hazardous waste into Africa. However, the majority of electronic waste exports still go to Asia, where the cost of recycling is particularly attractive (Bernard, 2011).
Kellenberg (2012) sought to test the waste haven hypothesis economically, according to which companies in industrialized countries, which on average have stricter environmental standards than the rest of the world, will tend to export their waste to countries where regulations are virtually non-existent, thereby benefiting from particularly low waste treatment costs. He demonstrates that when a country’s environmental policy rigor index deteriorates by 1% relative to its trading partner, imports from that partner country increase by 0.32%, all other things being equal. This result supports the waste haven hypothesis and shows that environmental regulations are central to the motivations for international trade. As expected, distance has a negative impact on the volume of waste trade between two countries, while a common language or border has a positive impact. It also shows that countries with a productive recycling sector are less likely to export, but if they do export, they tend to do so to countries with a less productive recycling sector. According to Kellenberg, this decision can be explained by the fact that the marginal cost of exporting waste is lower than the cost of building national waste management facilities or relocating the entire production abroad. Relocation costs are particularly high for capital-intensive industries, and therefore « directly » exporting pollution is more advantageous.
North-North flows: between specialization and incineration?
North-North flows of waste trade are predominant, and this trade is very widespread in Europe, particularly for reasons of proximity: sometimes the nearest recycling industry is located just across the border.
The decision may also be based on the choice of technology and infrastructure best suited to receiving the waste (industrial specialization). Germany is the second largest importer of waste according to Bernard et al. (2012), mainly because it specializes in the treatment of toxic waste (bis). If the waste is not recoverable and there is a legal obligation to treat it, as is the case for much toxic waste, then the potential value of the waste is always negative and importers receive financial compensation for importing this waste.
Another trend that seems to be emerging is the importation of waste for incineration with energy recovery (particularly plastics) to northern European countries (Norway, Sweden, Belgium, Netherlands, Germany), according to numerous articles, in order to « feed the incinerators » and thus keep them running, given that it is costly to shut them down and restart them (e.g., The Guardian, 2013; Zero Waste Europe, 2013, The Guardian, 2015). The graph below clearly shows that the Netherlands, Germany, and Belgium are the main importers of plastic waste (high energy potential) in Europe, but it is not possible to interpret these graphical results. The Guardian article documents an incineration overcapacity, which would prompt Norwegians to import waste for incineration, particularly from Great Britain. In turn, it would be more advantageous for the British to pay the Norwegians for incineration (negative value of the waste) than to pay the British landfill tax. The NGO Zero Waste is concerned that incineration is taking place at the expense of recycling.
Figure 1: Plastic waste imports in Europe (EU-27; cumulative tons)
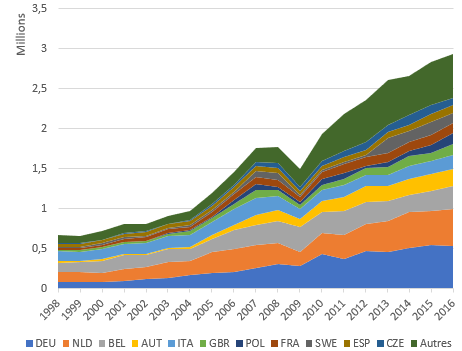
Sources: UN Comtrade data; graph by the author, BSI Economics
NB: Belgium includes Luxembourg; Norway is not included in the graph.
Conclusion
The waste trade appears to be the result of a rational strategy to optimize the value of waste. Economic agents demand waste in order to profit from waste treatment activities or to recover materials at low cost. However, this strategy can pose an environmental problem if certain types of waste are exported to countries that do not have the necessary capacity to treat them without endangering the natural environment and public health. To overcome these difficulties, waste flows are controlled by customs and governed by international conventions, such as the Basel Convention, which prohibits the export of hazardous waste to developing countries. However, numerous cases of illegal flows prove that a parallel trade continues to exist.
Recommendations:
- Northern countries have every interest in investing in waste treatment industries, as this would enable them to develop a comparative advantage and avoid exports to countries that do not have the appropriate technology.
- However, incineration capacity should be limited to non-recyclable waste.
- Southern countries must protect themselves from the « waste haven » effect by raising their environmental standards.
Bibliography
ADEME (2016) « Waste. Key figures, » 2016 edition. Available at http://www.ademe.fr/sites/default/files/assets/documents/dechets-chiffres-cles-edition-2016-8813.pdf
BAN (Basel Action Network, 2005): « The Digital Dump: Exporting Re-use and Abuse to Africa, » media release version.
Bernard, C. (2011) « 9. Health consequences of the trade in electrical and electronic waste from North to South » in Dominique Kerouedan, Santé Internationale, Presses de Sciences Po (P.F.N.S.P.) « Hors collection, » pp. 157-167.
Bernard, S., Dussaux, D., Fodha, M., and Glachant, M. (2012): « Le commerce international des déchets » (The international trade in waste), in L’Économie Mondiale 2013, pp. 104-118, CEPII, Repères collection, La Découverte edition.
Copacel (2016): « Price survey. Prices of types of paper and cardboard for recycling purchased on French markets and destined for recycling plants. »
http://www.copacel.fr/media/document/fichier/releve-prix-pcr-01-2016-2.pdf
Dato, P. (2017): « Economic analysis of e-waste market, » Int. Environ. Agreements 17:815-837
Famae (2017)
https://challenge.famae.earth/files/fr/waste.pdf
EEA (European Environment Agency), (2009): « Waste without borders in the EU? Transboundary shipments of waste. »
Kellenberg, Derek, (2012),: « Trading wastes, » Journal of Environmental Economics and Management, 64, issue 1, pp. 68-87,
The Economist (2017): « China tries to keep foreign rubbish out. » Article dated August 3, 2017
The Guardian (2013): « Trash to cash: Norway leads the way in turning waste into energy. » Article by Helen Russel, June 14, 2013.
The Guardian (2015): « Why are we still addicted to burning waste? » Article by Gina Lovett, August 3, 2015.
Tojo., N, Neubauer, A., and Bräuer I. (2008): « Waste management policies and policy instruments in Europe, » IIIEE Reports, part of the HOLIWAST project.
Zero Waste Europe (2013): « More incineration than trash to burn in the EU, » article by Joan Marc Simon, January 22, 2013.